Virginia Department of Education
States and Forms of Energy
Energy is just energy, right? Explain various forms of energy to your young scientists by using an interactive experiment that contains common objects to demonstrate complex concepts. Pupils conduct experiments for radiant, thermal,...
Curated OER
Virtual Field Trip
This hands-on resource has future trip planners analyze graphs of mileage, gasoline costs, and travel time on different routes. While this was originally designed for a problem-solving exercise using a Michigan map, it could be used as a...
Curated OER
Fire!, Probability, and Chaos
Upper elementary and middle schoolers work with the concept of probability. They are introduced to the concept of chaos. Learners graph and analyze using a line plot, work with mean, and are introduced to the concept of variance.
Curated OER
Lipstick Chromatography/Ink Chromatography
Junior crime scene investigators are instructed in two different chromatography exercises. For female suspects, they separate and compare lipstick pigments. For male suspects, they separate and compare ink samples. A data sheet is...
Curated OER
Blast Off
In this physical science exploration, small groups place a piece of antacid tablet into a film canister and step back to time how long it takes for the top to pop. They repeat the activity, altering either the amount or temperature of...
Curated OER
Energy Conservation Lesson 1: Fossil Fuels and the Ticking Clock
Students explore energy production by participating in a class discussion. In this renewable energy lesson, students discuss the differences between solar, coal, wind and fossil fuel energy sources and why some are better for the...
Curated OER
Basketball And Mathematics
Eighth graders collect and analyze data about foul shots taken at basketball games.
Curated OER
Survey and Tally
Second graders view a model of a survey and tally. In this survey and tally lesson plan, 2nd graders decide on questions for a survey. Students conduct the survey and tally their results. Students create a tally chart. Students view a...
Curated OER
Where Do I Fit on the Graph?
Students collect data and create graphs about themselves, their community, and the world around them. They use a variety of methods to organize data, such as stickers, clothespins, name tags, coloring, tally marks, etc.
Curated OER
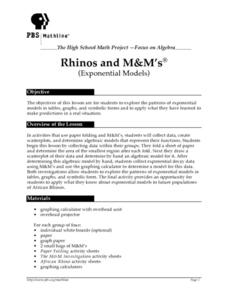
Rhinos and M&M's
Learners analyze patterns of exponential models by collecting data in paper folding and M&M investigations. They use graphing calculators to create scatter plots that lead to equations for the exponential models. They then apply this...
Curated OER
Ice Cream Pictograph
Students create a graph. In this pictograph lesson plan, students cut out 20 small ice cream cones and decorate them. Students create a pictograph with their ice cream cones.
Curated OER
Weight and Velocity
Students perform an experiment in order to determine how increasing weight affects the velocity of a truck and use the computer to compile their data.
Curated OER
Linear and Exponential Models
Students investigate the differences between linear and exponential models. In this linear and exponential models lesson, students make a table of given data. Students determine if the data is linear or exponential by plotting the data...
Curated OER
Math Journal: Functions and Coordinate Geometry
Fifth graders examine the many uses of coordinate grids. In this graphing lesson, 5th graders write data driven equations, discuss the x and y-axis, and determine if using 2 or 3 ordered pairs is better. Students complete several...
Curated OER
Graphing Favorite Fruit
Third graders take poll and sort data, enter the data to create a spreadsheet and create bar and pie graphs.
Curated OER
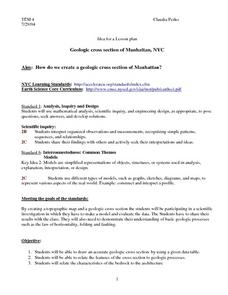
Geologic cross section of Manhattan, NYC
Students draw an accurate geologic cross section by using a given data table. They relate the features of the cross section to geologic processes. Students then relate the characteristics of the bedrock to the architecture.
Curated OER
Math: Graphs and Their Symbols
Second graders examine different types of graphs and discover the meanings of the symbols used on them. After gathering data about themselves, their communities, and the world, they use that information to create graphs. Among the...
Curated OER
Lifting a Load
Students experiments with levers to determine if the amount of force needed to lift a load is always the same. For this physics lesson, students use Lab-Pro data collector as they experiment with the fulcrum placement to measure the work...
Curated OER
Baseball Relationships - Using Scatter Plots
Students use graphing calculators to create scatter plots of given baseball data. They also determine percentages and ratios, slope, y-intercepts, etc. all using baseball data and statistics.
Curated OER
What's Your Favorite Planet?
Fourth graders, after listing the nine planets and their differences, choose one planet as their favorite. From the information acquired on each students favorite planet, they make a graph illustrating their favorites and then transform...
Curated OER
Decisions, Decisions, Decisions
Students examine graphs to find the most appropriate for various kinds of data. In this graphing instructional activity, student create bar, line and circle graphs. Students create graphs electronically and manually interpreting the data.
Curated OER
Graphing
Students collect data to create different types of graphs-line, pie, and bar graphs. They use StarOffice 6.0 to create graphs.
Curated OER
Graphing Pasta
Students sort and graph various types of pasta. Using pasta construction paper patterns or real pasta, they sort the pasta by color, size, and type, and record the data on a graph.
Curated OER
Excel temperature Graphs
Students gather data about the weather in Nome, Alaska. In this Nome Temperature lesson, students create an excel graph to explore the weather trends in Nome. Students will find the average weather and add a trend line to their graph.


