Curated OER
Apple Adjectives
Study different apple varieties and use appropriate adjectives to describe them. Learners alphabetize both the apple names and the adjectives before creating spreadsheet, bar, and pie graphs. A mix of language arts, technology, and math!
Curated OER
Making and Using a Graphic Organizer for Solving a Mystery
Students create tables in a word processing program which helps them organize their text clues when reading a mystery story. They develop reading comprehension strategies while using a computer based graphic organizer in order to solve...
Curated OER
Anatomy of an Element
Learners discuss matter and atoms using this resource. First, they look at a website describing atoms. Then, they learn about the periodic table and discuss how it is organized. Finally, they create a comic strip to display their...
University of Georgia
Resumé of an Element
Class members use the provided worksheet to create a resume for one element from the periodic table. The activity teaches learners about all of the properties of elements and how to read the periodic table.
Curated OER
Patterns Everywhere!
Learners recognize and demonstrate the patterning of numbers and objects in our environment. They create a pattern using geometric shapes and find a missing number in a sequence.
Curated OER
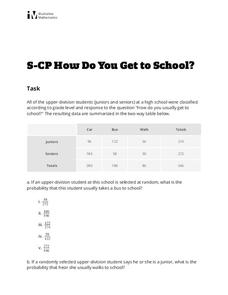
How Do You Get to School?
Looking for a short assessment on probability? Learners use a two-way table to calculate a probability and a conditional probability. Multiple choice answers could be eliminated to create a short-answer activity for your class. There are...
Curated OER
Favorite Apple Graph
First graders record their favorite type of apple in the form of a graph. They each try one slice of a Red Delicious, Golden Delicious, and Granny Smith apple, select their favorite type, and create a class graph using the data collected.
Curated OER
Old Glory
Learners utilize mathematical concepts such as: measurement, ratio and proportion and geometric probability to analyze the components of the U.S. Flag. They collect, organize and interpret data by constructing charts, tables and graphs...
Curated OER
Investigation - Looking For Triangles
Seventh graders investigate a series of triangles, looking for patterns and generalizing what they have found. They analyze the pattern data and organize it into a table and graph. Students identify the relationship and discover the rule...
Curated OER
Capture/Recapture
Students use proportions to estimate the size of populations. They describe the data with using a graph or table of the estimate. Students use descriptive statistics to calculate mean, median, and mode. They also compare and contrast an...
Curated OER
Graphing Toys!
Jason, Michelle, Sofia, and Willis all have a variety of toys. Use the chart provided to graph how many toys each child has. Who has the most toys? Who has the least? Help your learners study the graphs they create to better understand...
Curated OER
Fabulous Fractals
Students view a video to discover how patterns in nature relate to math. They explore the concept of exponential growth by observing and creating fractals. They solve and design word problems.
Curated OER
Organizing our Favorite Books
Students identify the title and author of stories. They create a database that supplies both graphic and written information to identify a book.
Curated OER
The Trapping of Trapezoids
This is a nice hands-on activity where young geometers create trapezoids and calculate their area by looking at areas of quadrilaterals and triangles.
Curated OER
Circle Graphs
In this circle graphs worksheet, learners solve and complete 8 different problems that include word problems referring to two different circle graphs shown. First, they follow the directions for each problem and complete the table that...
Curated OER
Excel
In this technology worksheet, students are taught how to create documents using Excel. They follow the directions on a handout to help them create documents. They print their final work and submit it.
Curated OER
What's Up With the Water Cycle?
Students explore the water cycle. Students identify the stages in a water cycle and create a PowerPoint presentation based on their knowledge.
Curated OER
Name that metal!
Learners have to have had some experience with metals prior to using this worksheet. They are given five properties common to five different metals. They create or use a dichotomous key to identify the five mystery metals. Tip: This...
Curated OER
Germs Experiment 2
Students express artistic ideas thru art glitter and science. Students experiment with the theory of how germs spread. Students summarize findings in an art format. Students work in groups to analyze data.
Curated OER
Excel Lesson Plan Coin Statistics
Second graders determine the difference between making a prediction and determining actual information. They design a spreadsheet for a coin flipping activity on which they include their predictions and what actual happens when they flip...
Curated OER
Windmills and Blogs: The Impact of Technology in Rural Peru
How does technology affect a community? Research the benefits and consequences of technology in rural Peru. For this technology lesson, learners discuss how the effects of technology. They view a PowerPoint and learn about the Peace...
Curated OER
Scale Model of the Solar System
Lead your class through the procedure to create a scale model of the solar system. This resource reinforces concepts of scale and the mathematics involved, as well as the planets. Attach paperclips and staples to index cards to show the...
Curated OER
Quilting Geometry
Study geometry through the concept of quilt design. High schoolers examine the geometric shapes in various quilts and then create their own quilts using geometric shapes that fit together. In the end, they write a paragraph to describe...
Curated OER
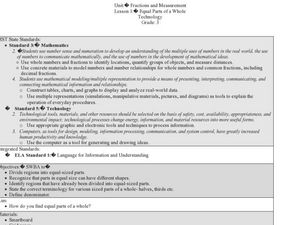
Fractions and Measurement
Using a Smart Board, or a plain ol' white board or chalkboard, the teacher pulls up a grid and demonstrates how squares and rectangles can be divided up into equal parts. The class will get their own graph paper to draw shapes and divide...


