Curated OER
Graph it!
Sixth graders view a Stacked Graph, and discuss what it shows. Students discuss the basics of graphing: labels, intervals, legends x and y axis... Students create individual stacked graphs from provided information. Students view a...
Curated OER
Discovering the Magical Pi
Students calculate pi using data on the circumference and diameter of various objects. They define key vocabulary terms, measure the circumference and diameter of various circular objects, organize the data on a table or chart, and...
Curated OER
Fruit Loop Graphing
Fifth graders interpret data and create graphs. Given Fruit Loops, they sort and classify according to color. Using spreadsheet technology, 5th graders record their data and create bar and circle graphs. Students analyze data and...
Curated OER
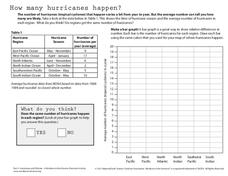
How Many Hurricanes Happen?
In this hurricanes activity, students use a data table showing the hurricane region and the average number of hurricanes per year to determine if the same number of hurricanes happen in each region by creating a graph. Then students...
Curated OER
Making Sounds
Students perform three experiments to gain understanding of how pitch changes. In this sound lesson, students create a variety of sounds with different pitches. Students will record their data as the observe the differences in the sounds...
Curated OER
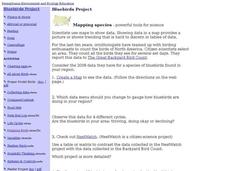
Bluebirds Project: Mapping Species
In this bluebirds project: mapping species worksheet, students create a map based on data for bluebirds in their area, then answer 5 questions about the mapping of the species. This page has numerous links to helpful web...
Curated OER
State Economy Chart
Fifth graders research and record statistics on the economy of an assigned state. They create a spreadsheet in Excel to report the data and a 3D Pie graph using the Chart Wizard in Excel to represent their states' data.
Curated OER
Lines of Fit
Students graph an equation and analyze the data. In this algebra lesson, students graph scatter plots and identify the line of best fit using positive correlation, negative correlation an d no correlation. They apply their data analysis...
Curated OER
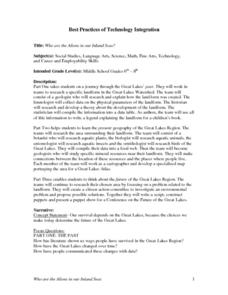
Who Are the Aliens in Our Inland Seas?
Middle schoolers work in teams to research specific landforms in Great Lakes Watershed, compile information into data table, and write legend explaining landform for children's book. Students then research area surrounding landform,...
Curated OER
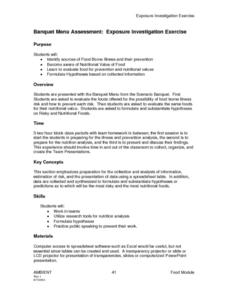
Banquet Menu Assessment: Exposure Investigation Exercise
Students identify sources of Food Borne illness and their prevention. They formulate hypotheses based on collected information. Pupils become aware of Nutrintional value of food. Students collected data are synthesized to formulate...
Curated OER
Oxidation and Salt
Students study the reaction on iron in water, air, and sodium chloride. They create a situation that shows this process and gives them the opportunity to hypothesize what, why, and how. They keep records and do an oral and written ...
Curated OER
Probabilities for Number Cubes
Students explore the concept of probability. In this probability instructional activity, students roll a six-sided number cube and record the frequency of each outcome. Students graph their data using a frequency chart and...
Curated OER
Line 'Em Up!
Learners find coordinate points on a grid and create a line graph with those points. This lesson should ideally be used during a unit on various types of graphs. They make and use coordinate systems to specify locations and to describe...
Curated OER
Let's Keep Track of Grades
Learners participate in a technology project. This lesson is a hands-on spreadsheet project where students are responsible for keeping track of their grades for class. The learners learn to enter data into a spreadsheet, create...
Curated OER
Build a Skittles Graph
Students construct a bar graph with a given set of data. They calculate the ratio and percent of the data. Students discuss alternate ways of graphing the data as well as multiple strategies to approach the task.
Curated OER
What on Earth is a Biome?
Students explore organisms and their environments. They examine change over time
demonstrate an understanding of physical positions on Earth. They survey earth's diversity, write a report, fill in a data table created on the...
Curated OER
U.S. Post Office Mural Walking Tour
Students discover a sense of community by examining Post Office murals located in cities and small towns throughout the United States. They explore the significance of the murals by contacting and communicating with local Postmasters....
Curated OER
Linear Equations
Students discover the equation of a line. They accurately record data collected from the game, "You're On A Roll", create number sentences by rolling dice, and choose their own values for the multiplication and addition steps.
Curated OER
Solar Flare Reconstruction
In this solar flare reconstruction activity, students read about the 'saturation' point of satellite detectors when solar flares are at their most intense phase of brightness. Students are given x-ray flare data and they re-plot the data...
Curated OER
Get On Board
Students create a ticket table illustrating the cost of tickets by alternative transportation. In this number sense lesson, students write number sentences to compare and contrast difference information in their chart. Students figure...
Curated OER
Probability Using M&M's
Students estimate and then count the number of each color of M&M's in their bag. In this mathematics lesson, students find the experimental probability of selecting each color from the bag. Students create pictographs and bar graphs...
Curated OER
Charting Historical Gas Prices
Learners investigate the historical and current prices of a gallon of gasoline. Using an online tool, they calculate the inflation-adjusted cost of gasoline over the years, and create a graph to demonstrate the actual cost vs. the...
Curated OER
The Big Bang-Hubble's Law
In this Hubble's law worksheet, students use data for galaxies which include their distance and speed. Students make a graph to show the distance to each galaxy and the speed of each galaxy. They use their graph to answer 4 questions...
Curated OER
Volcano Hazards
Students research volcano hazards in VolcanoWorld, make a paper volcano, produce and watch the effects of ashfall, produce and watch the effects of a mudflow and create a hazard map by plotting historical ashfall/mudflow data from Mount...


