Curated OER
Which Car Should I Buy?
Students use gas mileage of different cars to create T charts, algebraic equations, and graphs to show which gets better mileage. In this gas mileage lesson plan, students use the graph to see which car they should buy.
Curated OER
Career Exploration
Students complete a unit about career choices. They conduct research on a selected career that interests them, conduct an interview, explore various websites, create a five-page HyperStudio stack, and write ten checks that relate to...
Curated OER
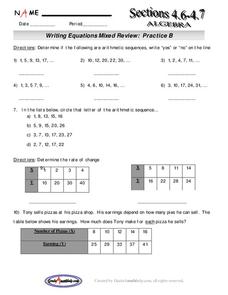
Writing Equations Mixed Review
Learners write equations based on a pattern. In this algebra lesson, students calculate the arithmetic and geometric mean of a sequence. They rewrite word problems as a linear equation and solve real life scenario based on the given data.
Curated OER
A Neighborhood Expedition
Students plan and conduct an expedition through their neighborhood based on the techniques used by the Harriman Expedition to Alaska in 1899. They research the Harriman expedition on the internet and then create a route and collection...
Curated OER
Money Management
Young scholars choose an occupation and set up a paper family and household. They create a monthly budget, pay monthly bills and file taxes. They practice math skills using financial information and view money as a resource. They create...
Curated OER
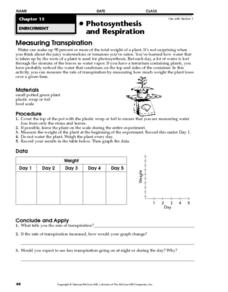
Measuring Transpiration
In this transpiration worksheet, students will conduct an experiment to measure the rate of transpiration from a plant by measuring how much weight the plant loses over 5 days. Students will record their data and create a graph of the...
Curated OER
Shoe Classification Lab
Students use shoes to make a classification flow chart. In this classification lesson plan, students all take one of their shoes off and put it on a table. In groups they create a classification system based on 3 characteristics of the...
Curated OER
Do Fast CMEs Produce Intense SPEs?
In this coronal mass ejections and Solar Proton Events worksheet, students create a Venn Diagram to represent given data. They answer 5 questions about the data related to the number of coronal mass ejections and Solar Proton Events...
Curated OER
Hurricane Frequency: Identifying Regions with Similar Numbers of Hurricanes
In this earth science worksheet, students answer 6 questions about the hurricane map and data provided. They create a data table based on the information provided on the map.
Curated OER
Endocrine Disruptors in Our Drinking Water: Should We Be Concerned?
Young scholars investigate the different hormone contaminants in the water supply. In this math lesson, students analyze data tables and graphs. They demonstrate exponential growth and decay using frog populations.
Curated OER
What's the Matter? (Grade 3)
Third graders organize information about the three types of matter and to reinforce concepts learned in the matter unit of the science curriculum. They use Inspiration software to create a concept map of the three types of matter.
Curated OER
Spaghetti Bridges: Student Worksheet
In this math worksheet, students will create a "bridge" out of spaghetti and test it's strength with pennies. Students will record their results on a table and then graph the results.
Curated OER
Rock Candy Crystals
Students discover how rocks are created. In this rock formation lesson, students investigate saturation, evaporation, and phase changes in geology. Students create rock candy from skewers, string, boiling water and sugar.
Curated OER
Judge and Jury
Learners participate in activities in which they focus on the uses of numbers. For this numerology lesson, students measure distances using standard and non-standard units and record their measurements in various tables. Learners also...
Curated OER
Mapping the Ocean Floor
Students construct and interpret a line graph of ocean floor depth and a bar graph comparing the height/depth of several well-known natural and man-made objects and places. In addition, they calculate the depth of two points using sonar...
Curated OER
Volume of Gas
Eighth graders investigate the effect of temperature on the volume of a gas in a closed container. They measure the height of the water in their beaker/container, conduct their experiment, and create a graph to illustrate their data.
Curated OER
Energy Efficient Buildings
Seventh graders create plans for an energy efficient addition to the school. They work in small groups with each group having responsibility for examining one aspect of the problem. They create working diagrams and a model of their...
Curated OER
How is a Star's Color Related to Its Temperature?
In this star color and temperature worksheet, students create a Hertzsprung-Russell diagram in order to determine how star brightness, color, temperature, and class are related. Once diagram is complete, they answer 6 short answer...
Curated OER
Satellite Technology
In this satellite technology worksheet, students read about Low Earth Orbit satellites and the frictional drag from the Earth's atmosphere that causes them to fall back towards the Earth. Students use given data of the years the...
Curated OER
Counting the Stars in Draco
In this counting stars worksheet, students construct a histogram for stars in a given star field using their apparent magnitude. Students answer 5 questions using their tabulated data and histogram to answer questions about the stars of...
Curated OER
Which Method Will You Choose? Finding Solutions to Systems of Equations.
Ninth graders investigate systems of linear equations. In this Algebra I lesson, 9th graders determine which method is the best for solving a systems: graphing, substitution, or elimination. Students choose a method and create a...
Curated OER
Pythagorean Theorem
Students discover the Pythagorean Theorem. In this discovering the Pythagorean Theorem lesson, students measure the lengths of various triangles to the nearest centimeter. Students record their measurements in a table. Students square...
Curated OER
Off to Work We Go!
Students create a book about The Great Depression in West Virginia. In this West Virginia history instructional activity, students visit the West Virginia State Museum, answer questions about West Virginia history, and create a book...
Curated OER
Green Food Graph
Students explore graph making by investigating St. Patrick's day food. In this holiday food lesson, students discuss their favorite green foods in honor of St. Patrick's day. Students create a graph based on the data of which green foods...


