Curated OER
Tally Chart Practice
In this tally chart activity, students will read about tally charts and their uses. Students will make a list of when and why they could make a tally chart. Next students will complete a tally chart and write statements about the...
Curated OER
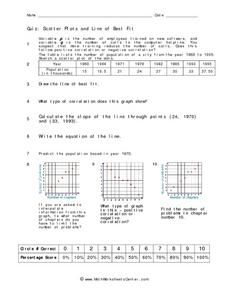
Quiz: Scatter Plots and Line of Best Fit
In this scatter plots and line of best fit worksheet, students create scatter plots from given sets of data. They answer questions concerning the scatter plot. Students write the equation of a line, identify the type of correlation...
Curated OER
Nanofibers: Why Go Small?
Students explore the surface ratio of an object. In this surface area to volume lesson students construct a data table, make calculations and create a graph.
Curated OER
Food Groups in our Lunch
Students make a graph. In this food groups and graphing lesson, students pack a sack lunch and then work in groups to tally the number of foods from each food group that they have. Students use the data collected to create a graph using...
Curated OER
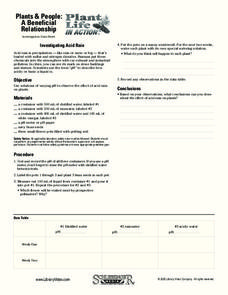
Plant Life In Action
Int his plant worksheet, students folllow the given directions to create an experiment. Students then answer 5 short answer questions and complete the given data table with results for two weeks.
Curated OER
Effects of chemical use in Agriculture
Students research environmental data to create a bar graph. In this agricultural ecology lesson, students research the pros and cons of chemical use in farming. Students debate on passing a law to reduce chemical use.
Curated OER
Disorders of the Brain
Students, in groups, conduct research about a specific disorder of the brain, create a character study of a person with that brain disorder, and then present the information to the rest of the class.
Curated OER
The Amazing and Beautiful Aurora
Students create an oil pastel painting. In this pastel painting lesson plan, students examine images of the aurora borealis. Students produce an original pastel painting of the aurora.
Curated OER
Mathematics of Scale
Students problem solve to calculate the number of times various listed objects could fit onto Tacoma Narrows Bridge. They create a scale drawing of the listed objects in comparison to the bridge.
Curated OER
PLANNING A DIVERSIFIED INVESTMENT PORTFOLIO
Twelfth graders research stocks and how to read and interpret financial data. They choose 5 companies to invest in and track their performance over 10 weeks. They create a spreadsheet which shows the results.
Curated OER
Shell Sort; Serving up Seafood
Students complete various small group activities to classify items and determine the types of combinations that can be made with these items. In the second lesson, students create menus for a restaurant to help them gain money sense and...
Curated OER
From Sea to Shining Sea
Students study the geography of the United States of America. Students write letters, create travel brochures, make maps, graph population numbers, read fiction and nonfiction selections, complete KWL charts, and watch films.
Curated OER
Welcome to New York State
Students choose one region of New York state, and create a travel brochure that includes information such as geographical features, tourist attractions, accesibility, economic features, and historical events that occured in that region.
Curated OER
The ABC's of Industry
Students define and explore Industry. They access times during the Industrial Revolution in America. Students view how business functions in any economy. They summarize the three sectors of industry by creating and interpreting a web...
Curated OER
The Twelve Days of Christmas
Students purchase gift items and practice collecting, analyzing, computing, and recording information. In this data lesson plan, students also complete money equivalent activities.
Curated OER
Fruity O Fractions
Fifth graders become mathematical problem solvers using cereal to help demonstrate fractions and equivalent fractions. They use a graph to represent the data, and to compare fractions.
Curated OER
RESEARCH PROJECT
Students develop a list of famous people and choose an individual from the list. They create a web design for notes. They research their individual and add information to their bibliography. They finish by writing a report on the person.
Curated OER
Map Skills
Students examine the nations, battlefields, troop movement of the Germans through Belgium and the location of both fronts during World War I by creating a map. They visualize the strength of the Germans early in the war.
Curated OER
Global Carbon Cycle
Pupils, in groups, create posters of the flow of a carbon atom as it travels through the carbon cycle. They make connections about how human activities affect the carbon cycle, as well.
Curated OER
Ratios
Sixth graders investigate the concept of ratios and how they can be used to represent the comparison of quantities. The lesson is taught using a table or graph to compare two categories of data.
Curated OER
Discovering Pi
Sixth graders discover Pi. In this discovering Pi lesson, 6th graders measure the diameter and circumference of various circular objects. Students record their measurements in a table. Students discuss how Pi relates to the...
Curated OER
Variable Arrays
Twelfth graders compare and contrast variables and arrays. Using data, they enter the information into a spreadsheet and an array to compare how they appear. To end the lesson, they complete basic programs in which they use arrays.
Curated OER
Functions As Graphs Worksheet
In this math worksheet, young scholars graph the data given in the organizer. The functions are used to create the new line for finding the possible unknowns.
Curated OER
Folk Remedy Collection Worksheet
In this folk remedy collections worksheet, students collect and record data once they interview people about remedies to various ailments.


