Curated OER
Hard Water
For this water worksheet, students read how hard water is created and what can be done to soften the water. Then students complete 6 short answer questions.
Curated OER
Business 90 Midterm 2: Probability
In this probability worksheet, students examine given business situations and determine the probability of an event. They create tree diagrams and contingency tables. This nine-page worksheet contains 7 multi-step problems.
Curated OER
Composite Functions
Students create a poster to explain composite functions. In this composite function worksheet, students explore linear equations and functions. They complete a worksheet and use manipulatives to complete problems.
Curated OER
Introduction to Inverse Functions
Students investigate patterns of inverse functions. In this algebra lesson plan, students represent functions with the calculator and on paper. They analyze their data and draw conclusions.
Curated OER
Patterns and Functions
Learners investigate patterns and functions. In this algebra lesson, students examine the repetition of integers and objects. They create formulas for the repetition and identify them as function using equations.
Curated OER
Exponential and Exponents Functions
Students solve problems using exponential properties. In this algebra lesson, students differentiate between exponents, exponential and log functions. They graph their functions using table and exponents.
Curated OER
Round and Round and Round We Go!
Students investigate motion using a CBL. In this algebra instructional activity, students collect and graph data on a coordinate plane. They define and identify amplitude and period of conic graphs.
It's About Time
Energy from Coal
If plastic is derived from fossil fuels and fossil fuels come from dead dinosaurs, does that mean that plastic dinosaurs are made from real dinosaurs? This lesson goes into depth about coal and other fossil fuels. First the instructor...
Virginia Department of Education
Transformation Investigation
Graph it! Investigate transformations with a graphing calculator. Pupils graph sets of linear functions on the same set of axes. They determine how changes in the equation of a linear function result in changes in the graph.
Curated OER
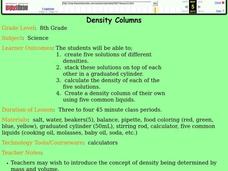
Density Columns
Eighth graders create solutions with 5 different densities. In this chemistry lesson, 8th graders analyze the density of solutions stacked on top of each other. They document their data through graphing. This assignment requires 4 class...
Curated OER
Veterans Day Remembered
Sixth graders gather information about Veterans and create a PowerPoint. In this Veterans remembered lesson, 6th graders interview a veteran and research on the computer to create a five slide PowerPoint.
NOAA
What Killed the Seeds?
Can a coral cure cancer? Take seventh and eighth grade science sleuths to the underwater drugstore for an investigation into emerging pharmaceutical research. The fifth installment in a series of six has classmates research the wealth of...
Biology Junction
Plasma Membrane – Gateway to the Cell
Just as skin covers your body limiting what can go in and out, plasma membranes cover cells to do the same. Scholars begin with a presentation that gives overview of the structure and function of plasma membranes. Then, they learn how...
Curated OER
VARIABLES AND PATTERNS, USE AFTER INVESTIGATION THREE. DISCRETE OR CONTINUOUS LINEAR RELATIONS.
Learners discover for which kind of linear function is appropriate to use the "scatter" or the "connected" term. In this instructional activity, students investigate functions using variables, patterns book, graph paper, rulers and the...
Curated OER
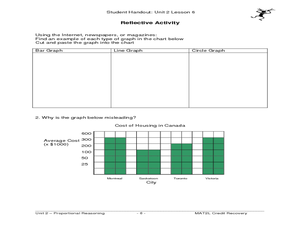
The Circle Graph
In this circle graph worksheet, students complete problems involving many circle graphs including a compass rose, degrees, and more. Students complete 7 activities.
Curated OER
Rising Tensions Over The Nile River Basin
Students analyze the concept of global commons dilemma. In this investigative lesson students read an article on the Middle East Media Research Institute and answer questions accordingly.
Curated OER
Using Graphs and Charts
Students complete T charts and manipulate numbers using graphs and charts. In this math graphs and charts instructional activity, students review the concepts of pattern and function. Students then complete practice pages where they...
Curated OER
Wordle It
Young scholars discuss, define, and give themselves character traits. In this character traits lesson plan, students create a list of ten character traits that describe themselves. Young scholars create a data table and poll their...
Curated OER
Bond with a Classmate
In this bonding worksheet, students record information about a selected ion in a data table, partner up with an ion of opposite charge and create a new compound, then complete 4 short answer analysis questions and write a brief...
Curated OER
Don’t Sit Under the Apple Tree…You Might Become Famous
Students explore Newton's laws using CEENBoTs. In this physics lesson, students collect data and create tables and graphs. They calculate speed, acceleration and forces using mathematical formulas.
Curated OER
Graphing and Analysis of Water Quality Reports
Students practice making graphs and interpreting them. They compare and contrast different sets of data. They use Microsoft Excel to create different types of graphs.
Curated OER
Checking County Numbers
Learners use their county's information page to gather information about their community. Using the information, they create graphs from the tables provided and interpret the data. They write a paragraph showing their interpretation of...
Curated OER
Graphing
Fifth graders create graphs based on climate in South Carolina. They read and interpret information in a chart and construct a graphy from the information in the chart. They create a spreadsheet using Excel and publish 2 graphs.
Curated OER
Graphing
Seventh graders identify the different graphs used in science. In this graphing instructional activity, 7th graders analyze the three kinds of graphs. They construct a graph that best describes a given data.


