Curated OER
Life in Streams and Ponds
Students collect microorganisms, demonstrate correct laboratory/Gram stain procedure, and design and construct tables to organize data.
Curated OER
Inventors Unit Survey
Students develop and conduct a survey for their inventors unit. They create a five question survey and tally the survey results, and create a graph using Microsoft Word and Graph Club 2.0.
Curated OER
Line Graphs
Seventh graders create a line graph and identify when to use line graphs. In this line graphs lesson, 7th graders analyze the average temperatures of various cities. Students graph the data they collected.
Curated OER
Plotting Wind Speed and Altitude
Students construct, read and interpret tables, charts and graphs. They draw inferences and develop convincing arguments that are based on data analysis. They create a graph displaying altitude versus wind speed.
Curated OER
How Do Clouds Affect Radiative Energy
Learners graph the upwelling and downwelling of shortwave radiation. They create a data table with the information. Students compute the Watts per square meter. They discuss their results and whether or not cloud type affects daily...
Curated OER
Put Your Heart Into It
First graders sort Valentine candies according to kind. Data is inserted into a spreadsheet and displayed in various graphic formats.
Curated OER
Monster Graph Activity
Seventh graders engage in a instructional activity which take the fear out of graphing. They create and draw conclusions from data found in a Monster graph.
Curated OER
Deceleration of a Toy Truck
Eighth graders complete labs using toy trucks to study deceleration, record thier data, and then transfer it to graphing software to produce a graph. They create a lab report of the completed lab using a word processing program.
Curated OER
Timed Multiplication Test Graphs
Students use the tools of data analysis for managing information. They solve problems by generating, collecting, organizing, displaying histograms on bar graphs, circle graphs, line graphs, pictographs and charts. Students determine...
Curated OER
Measuring the Speed of a Wave
Students create an experiment in which they measure the speed of a wave and record the data in a graph. They work in small groups to write the procedure for the experiment and share it with another group for cross checking of the...
Curated OER
WEATHER SATELLITE PREDICTION PROJECT
High schoolers compile weather satellite data from three satellites for one month, obtain weather reports and data from professionals, then create a document with predicted results.
Curated OER
Temperature Comparisons
Students practice plotting temperature data points on a line graph in groups and examine the temperature differences at the same time of year. They graph the temperatures in Lannon, WI, and Mitchell's Plain, SA. After the data has been...
Curated OER
State Economy Chart
Fifth graders create a 3D Pie graph using the Chart Wizard in Excel to represent their assigned states' data. They discuss the similarities and differences between states, and form a hypothesis on the relationship between location and...
Curated OER
The Effects of Environment on Plant Growth: Selecting Seeds for Survival on a New Planet
Fifth graders conduct experiments to compare seed germination and plant growth rates. They construct a hydroponic plant unit and a lighthouse. They care for the plants for a month and collect data for graphs. They write a report.
Curated OER
Streamflow
Learners discuss the topic of streamflow and how it occurs. They take measurements and analyze them. They interpret data and create their own charts and graphs.
Curated OER
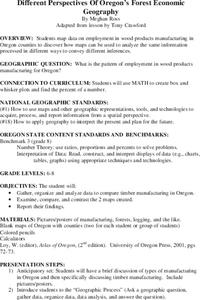
Different Perspectives of Oregon's Forest Economic Geography
Students locate the many forests located in Oregon. In groups, they use the internet to research employment data on wood products made in the state. They discuss how looking at information presented in a different way can change their...


