Curated OER
Horizontal Bar Graph
In this math worksheet, students create a horizontal bar graph. The bar graph includes eight lines going up and the numbers one through eight going across.
Curated OER
How Many Frogs?
Students explore the concept of linear regression. In this linear regression lesson plan, students find the line of best fit for a set of data pertaining to a frog population. Students use their line of best fit to predict the frog...
West Contra Costa Unified School District
Solving Systems of Inequalities
Don't throw away those transparency sheets just yet! Young scholars first review inequalities on a number line, then learn about graphing inequalities in the coordinate plane. Finally, they use overhead transparencies to create systems...
Teach Engineering
Forms of Linear Equations
Linear equations are all about form. The fifth part in a unit of nine works with the different equivalent forms of linear equations. Class members become familiar with each form by identifying key aspects, graphing, and converting from...
Bytes Arithmetic
Geometry Pad+
Graphing paper, pencil, ruler, protractor, and compass, all get replaced or supplemented with this dynamic geometry application. Here, you can create, move, and scale many different shapes, as well as, explore and change their properties...
K12 Reader
Displaying Data
It's important to learn how to display data to make the information easier for people to understand. A reading activity prompts kids to use context clues to answer five comprehension questions after reading several paragraphs about...
Balanced Assessment
A Fishy Story
There's nothing fishy about this resource. In the task, learners use given information about fish prices to create a scatter plot and line of best-fit. Later, they use the information to answer questions about the profit from fish sales.
Concord Consortium
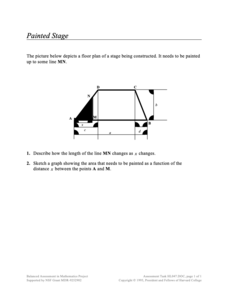
Painted Stage
Find the area as it slides. Pupils derive an equation to find the painted area of a section of a trapezoidal-shaped stage The section depends upon the sliding distance the edge of the painted section is from a vertex of the trapezoid....
Curated OER
Water Down the Drain
Did you know that leaky faucets waste $10 million worth of water? Conservationists perform an experiment and draw best-fit lines to explore how the US Geological Society determined this value.
Virginia Department of Education
Inequalities
Not all resources are created equal — and your class benefits! Scholars learn how to solve one-step inequalities using inverse operations. They complete an activity matching inequalities to their solutions.
Bowels Physics
Graphical Analysis
Assist your class in learning graphical analysis by reviewing the slide presentation. Class members review 15 slides to further understand concepts such as velocity and acceleration. They conclude with practice problems related to the...
Statistics Education Web
Text Messaging is Time Consuming! What Gives?
The more you text, the less you study. Have classes test this hypothesis or another question related to text messages. Using real data, learners use technology to create a scatter plot and calculate a regression line. They create a dot...
American Statistical Association
Scatter It! (Using Census Results to Help Predict Melissa’s Height)
Pupils use the provided census data to guess the future height of a child. They organize and plot the data, solve for the line of best fit, and determine the likely height and range for a specific age.
EngageNY
Segments That Meet at Right Angles
Can segments be considered perpendicular if they don't intersect? Learners look at nonintersecting segments on the coordinate plane and make conclusions about the lines that contain those segments. They determine if they are...
Statistics Education Web
The United States of Obesity
Mississippi has both the highest obesity and poverty rate in the US. Does the rest of the data show a correlation between the poverty and obesity rate in a state? Learners tackle this question as they practice their skills of regression....
EngageNY
The Opposite of a Number
It's opposite day! The fourth installment of a 21-part module teaches scholars about opposites of integers and of zero. Number lines and real-world situations provide an entry point to this topic.
Mathematics Vision Project
Equations and Inequalities
Help learners get their facts in line to build and solve complicated linear equations and inequalities. Pupils build upon their knowledge of solving basic equations and inequalities to solve more complex ones. Individuals work with...
August House
Why Koala Has a Stumpy Tail
Learn about the animals of Australia with a language arts lesson about an Australian folktale called, Why Koala Has a Stumpy Tail. After reading the story as a class, kids discuss events and characters from the book, retell the story to...
MARS, Shell Center, University of Nottingham
Defining Regions Using Inequalities
Your young graphers will collaboratively play their way to a better understanding of the solution set produced by the combining of inequalities. Cooperation and communication are emphasized by the teacher asking questions to guide the...
Mathematics Assessment Project
Representing Inequalities Graphically
A new, improved version of the game Battleship? Learners graph linear inequalities on the coordinate plane, then participate in a game where they have to guess coordinate points based on the solution to a system of linear inequalities in...
CK-12 Foundation
Derivatives of Trigonometric Functions: Derivative of sin(x)
Graphically find the derivative of sin(x). Using the interactive, pupils graph the slope of the tangent line to the sine function. Class members use the resulting graph to determine the derivative of the sine function. They verify their...
PBL Pathways
Doctors and Nurses
How many nurses does it take to support one doctor? A project-based activity asks learners to analyze state data to answer this question. Classes create polynomial functions from the data of doctors and nurses over a seven-year period....
CK-12 Foundation
Even and Odd Functions and Function Symmetry: Even and Odd Functions (Symmetry)
Even money states that the resource is good to use. Scholars manipulate an interactive to adjust the portion of a graph to the left of the y-axis. The interactive allows them to switch between even and odd modes that show the right side...
CK-12 Foundation
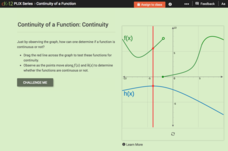
Continuity of a Function: Continuity
Does the point continually move along the graph? Pupils drag a line across two functions to determine whether they are continuous or not. They answer questions about the properties of continuous and discontinuous functions. Using their...


