Teach Engineering
The Challenge Question
A research position becomes a modeling job. The introductory activity in a series of nine presents the challenge of analyzing a set of bivariate data. The class brainstorms what the data may represent. Pupils must decide what is needed...
Los Angeles County Office of Education
Assessment For The California Mathematics Standards Grade 6
Test your scholars' knowledge of a multitude of concepts with an assessment aligned to the California math standards. Using the exam, class members show what they know about the four operations, positive and negative numbers, statistics...
CCSS Math Activities
Smarter Balanced Sample Items: 8th Grade Math – Claim 4
A math model is a good model. A slide show presents 10 sample items on modeling and data analysis. Items from Smarter Balanced illustrate different ways that Claim 4 may be assessed on the 8th grade math assessment. The presentation is...
Education Development Center
Distance, Rate, and Time—Walking Home
Dig into a classic math problem with your classes. Through an engaging task, learners work with rate and distance information to make conclusions. In the task, two people walk at different rates; one leaves first, and scholars calculate...
CK-12 Foundation
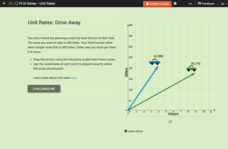
Comparison of Unit Rates: Drive Away
Five questions make up an interactive that challenges mathematicians to compare unit rates. Word problems question scholars about two friends going on a road trip. Scholars manipulate two cars on a coordinate plane to help solve word...
Alabama Learning Exchange
Jelly Beans Add Up
Students explore counting, sorting, and graphing skills. In this data analysis lesson, students sort jelly beans by color, count the jelly beans, and create a bar graph of the jelly beans according to color.
Curated OER
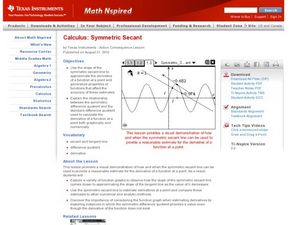
Symmetric Secant
Mathematicians use a symmetric secant line to prove the derivative at a point. In this trigonometry lesson, students create secant lines on the navigator to analyze the derivative. They move the lines around and make observations.
Curated OER
Looking for More Clues
Fifth graders explore how to collect data and display it on a bar and circle graph.
Curated OER
Which Car Should I Buy?
Students use gas mileage of different cars to create T charts, algebraic equations, and graphs to show which gets better mileage. In this gas mileage lesson plan, students use the graph to see which car they should buy.
Curated OER
The Konigsberg Bridge Problem
In this Konigsberg Bridge problem learning exercise, high schoolers solve 35 short answer problems. Students construct networks consisting of even and odd vertices. High schoolers make conjectures about the number of odd and even...
Curated OER
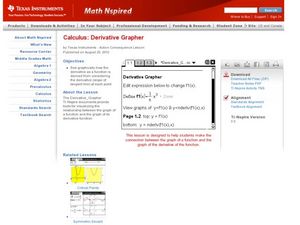
Derivative Grapher
Learners graph the derivative of functions in this calculus lesson. They use the TI to graph their functions and algebraically take the derivative of each function. They then create a visual and analyze the graph.
Curated OER
Is the Slope Legal?
Students define parallel and perpendicular lines. In this algebra lesson, students relate the concept of parallel and perpendicular lines to the real world. They classify the lines based on their slopes.
Curated OER
Electromagnets: Winding Things Up!
Students explore solenoids and electromagnets. After building an electromagnet, students use a TI Graphing calculator, a CBL 2 interface and a magnetic field sensor to measure the strength of a magnetic field. They create a graph of...
Mathed Up!
Cumulative Frequency and Box Plots
Learn how to display data. Young data analysts watch a video to review how to create cumulative frequency histograms and box plots. They work on a set of questions to practice producing these data displays.
Curated OER
Linear and Exponential Functions
This comprehensive unit on linear and exponential functions provides numerous clearly-written worksheets. Topics include graphing linear equations, solving systems of equations algebraically and by graphing, identifying the domain and...
Curated OER
Arkansas is Our State: Differentiating Between a State and a Country
An ambitious geography lesson is geared toward kindergartners. They discover what the differences are between states and countries. They look at maps of Arkansas, and learn what the shapes and lines mean. Additionally, they create a...
Curated OER
Scatterplots and Regressions
In this scatterplots and regressions worksheet, students solve 6 different types of problems related to graphing scatterplots and interpreting regressions. First, they create a scatterplot from the given data coordinates and then,...
Curated OER
Map Your School
Learners participate in a project to map their school. They measure and graph various areas around the school. Learners find the longitude and latitude of the school and research the school's history, and highlight special important areas.
Curated OER
Who's got the fastest legs?
Students use a stopwatch to collect information for a scatterplot. In this fastest legs lessons, students collect data through the taking of measurements, create and find a median number. Students develop an equation and answer...
Center Science Education
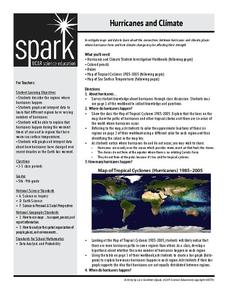
Hurricanes and Climate
Feeling under the weather? This lesson on hurricanes can whip things up! With professionally designed maps and handouts, teach your future weathermen (or women) where, when, and how hurricanes occur. They identify hurricane regions and...
Curated OER
Linear Equations
Seventh graders explore battle plans using grids. In this linear equation lesson, 7th graders see how math is used in battle. Students create a grid on the floor using tape and plastic army men to serve as the points. Students discuss...
Curated OER
Shattered Images Value Study
Young scholars create cubist drawings using grids and enlargement.
Curated OER
Time Management: Piece of Pie
Students examine their own lives and how well they manage their time outside of school. In this this time management lesson, students discover the amount of time they spend on other activities, and create a pie chart with that...
Curated OER
Blackout!
Students read news reports and first-person accounts of a blackout in a large city and keep weblogs or journals. They take on different roles of people who live in the city or commute there to work and then use their journal accounts to...


