Curated OER
Tree Measurement
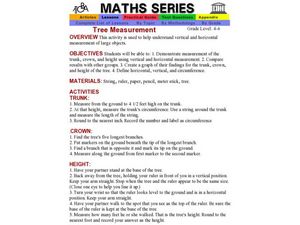
Learners explore vertical and horizontal measurement of large objects. In pairs, they measure the trunk, crown, and height of a tree, create a graph of their results, and compare their results with their classmates.
Curated OER
A Comparison of Land and Water Temperature
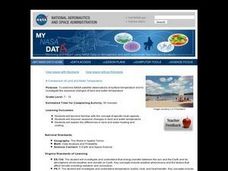
Students use the NASA website's Live Access Server to create a graph of surface temperature at two locations on earth. They analyze the data and then answer specific questions provided in this lesson. They also examine and compare the...
Curated OER
When Dinosaurs Ruled the World
Students graph the varying sizes of dinosaurs. In this math and dinosaur lesson, students view dinosaur models and compare the different shapes and sizes of the dinosaurs. Students complete a dinosaur math activity, read The Dinosaur...
Curated OER
The Big Bang-Hubble's Law
In this Hubble's law instructional activity, learners use data for galaxies which include their distance and speed. Students make a graph to show the distance to each galaxy and the speed of each galaxy. They use their graph to answer 4...
Curated OER
Black History Project
Third graders explore and analyze about famous African-Americans by listening to four picture book biographies. They generate a list of 15 famous African-Americans and then create a survey to rank them according to importance of...
Curated OER
Good Health Care
Students work in collaborative groups researching topics such as nutrition, the benefits of exercise on the body, dental and personal hygiene. They conduct interviews, create charts and posters, and report their results with a written...
Curated OER
Weather Data Analysis
In this weather worksheet, students read a data table comparing the temperature and weather conditions at three different locations. Students use this data to complete 8 fill in the blank, 1 short answer question, and one graph.
Curated OER
Jack and the Beanstalk Math
Students listen to Jack and the Beanstalk and determine what they think are the most common words. In this Jack and the Beanstalk lesson, students reread the story, count the words they chosen and graph those words. Students graph the...
Curated OER
Solar Power
Fifth graders create their own solar panel. They use this experiment to see how the sun can be used as a form of energy.
Curated OER
Energy Efficient Buildings
Seventh graders create plans for an energy efficient addition to the school. They work in small groups with each group having responsibility for examining one aspect of the problem. They create working diagrams and a model of their...
Curated OER
After the Garbage Can: Where Does Our Trash Go?
Learners explore how waste disposal has changed over time and what the current issues are. In this disposal instructional activity students collect data and create graphs.
Curated OER
Properties of the Ocean: Change
Learners research and create a visual presentation on the seasonal salinity of the Earth's oceans. They apply the research in a simulation of a lab disaster in which they must relabel ocean samples.
Curated OER
Conic Sections
Students explore the different properties of conics. In this algebra lesson plan, students calculate the midpoint of a line, the distances between two points as they get ready to find the focus and directrix in eclipse and other conics....
Curated OER
Statistics with State Names
Students analyze the number of times each letter in the alphabet is used in the names of the states. In this statistics lesson, students create a stem and leaf plot, box and whisker plot and a histogram to analyze their data.
Curated OER
Your Area, Their Area
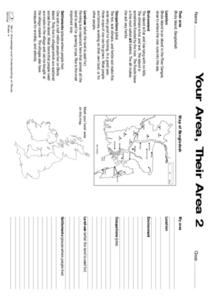
In this Your Area, Their Area worksheet, learners locate and identify an area on a map, then write short answers to factors about it. They then create a poster with materials provided.
Curated OER
Some Similarities between the Spread of an Infectious Disease and Population Growth
If the infectious diseases and population growth worksheet, students simulate the spread of an infectious disease by exchanging fluids in a lab activity. Students watch the spread of the disease and graph the spread of the disease vs....
Curated OER
Sequences in Geogebra
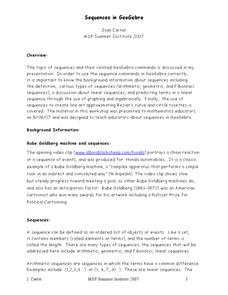
Students follow detailed directions to use the GeoGebra program. In this mathematics lesson, students find the nth term of a sequence, and use line art to approximate a Bezier's curve. Students locate points and segments on a circle. The...
Curated OER
Rocket Angles
Eighth graders create rockets that be launched at varying angles to determine which angle is best to launch at for the longest distance.
Curated OER
What's the Fizz Factor
Students as a class create a fountain using both coke soda, and mentos candy. In this science activity, students test which combination of coke and mentos products produce the tallest fountain. Students use the scientific method to track...
Curated OER
Exploring Linear Equations
Eighth graders follow the teacher as they enter information into the graphing calculator. They investigate different graphs to explain the slope of a line, the y intercept, and parallel lines.
Curated OER
Ratios
Fourth graders complete a taste test of different sandwiches, rate them, and then put them in a ratio graph. In this ratio lesson plan, 4th graders write what they learned about ratios after this activity.
Curated OER
Are You Coordinated?
First graders are introduced to a coordinate graph. They are given a graph and follow directions to place stickers in the designated blocks. They write coordinate points to identify the placement of their stickers.
Curated OER
Spreadsheet Activity
Learners create a spreadsheet to match a given sample. This includes adjusting column width and row height, changing alignment, changing size and style of print, changing number format.
Curated OER
Data Shuffle
Middle schoolers find an advertisement or newspaper using charts or graphs. They create another graph using the same information in a different format. They write a comparison of the two graphs.


