Hawaiʻi State Department of Education
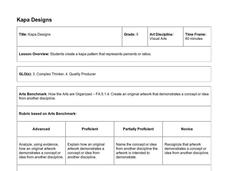
Kapa Designs
I always knew there was a connection between art and math, and this activity proves it. Fifth graders will use what they know about ratios and percents to design art inspired by Polynesian kapa cloth. A grid, specific guidelines, and the...
Hawaiʻi State Department of Education
Angles on Kandinsky
Not only is Wassily Kandinsky fun to say, his art contains tons of angles. Learners discuss Kandinsky's music-inspired abstract art and four types of angles. They search one of his paintings for obtuse, right, straight, and acute angles,...
Hawaiʻi State Department of Education
Rhythm Patterns
Fractions can be tricky. Why not have kids think of fractions like they think of eighth, quarter, and half notes? In teams, the class creates four-measure patterns with their percussion instruments. They need to explain their rhythm...
EngageNY
Polynomial, Rational, and Radical Relationships
This assessment pair goes way beyond simple graphing, factoring and solving polynomial equations, really forcing learners to investigate the math ideas behind the calculations. Short and to-the-point questions build on one another,...
Curated OER
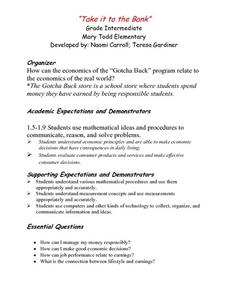
Take It To the Bank
Examine how the economics of a school store relate to real world economics. Elementary students explore various websites, complete a Venn diagram, create a schedule of wages for the students, read the book "A Chair For My Mother" and...
Curated OER
Number Operations
Inject fun into your math review! Pupils review basic math operations with decimals as well as addition and subtraction with simple fractions. In this number operations lesson, students work in groups to create a game for the math skill...
Curated OER
Exploring Number Systems
Students work in a group to prepare a poster about a new number system. They research a variety of number systems, create new symbols for their original number system and develop a tutorial for the class.
MENSA Education & Research Foundation
Shapes - Kindergarten
Extend scholars' learning experience with a unit consisting of five shape lesson plans, an extension activity, assessment, and rubric. Begin by reading a story about shapes, then conduct an overview and assign pupils' their first...
College Board
1999 AP® Statistics Free-Response Questions
Closer to 2010 than expected. Several of the 1999 AP® Statistics free-response questions align to Common Core standards. Items ask pupils to analyze residuals, two-way tables, and calculate expected values to determine the fairness of a...
Tech4Learning
Fantastic Fractions
Learners study how shapes can be divided into equal parts, that each part be equal to its counterpart, and combining parts equals one whole. They make the shapes out of modeling clay and take digital pictures of its parts to create an...
Alabama Learning Exchange
Wheels All Around
Budding mathematicians explore the concept of skip counting. They practice skip counting as they use it to determine the number of wheels that come to school at 3 different times throughout the day. They also create a data graph to show...
Federal Reserve Bank
Purchasing a Vehicle
Start your engines! Prevent negative car buying experiences by arming pupils with information. Prepare your young drivers to make informed decisions when they are ready to purchase a car. All aspects are considered from the type of car...
College Board
1998 AP® Statistics Free-Response Questions
Free-response questions form the 1998 AP® Statistics exam allow class members to analyze data from real-life situations. The situations include tracking defective parts, tracking butterflies, evaluating weed killers and determining...
Curated OER
The Luxor Hotel Contract
High schoolers determine the surface area of the Luxor Hotel, using the square feet of the base, volume, and the volume formula. They create a scale model of the triangular/pyramid shaped hotel.
Curated OER
Cartography Project
A instructional activity involving mapping, the use of a compass, writing and following directions, and exploring the first two themes of geography is here for you. Learners create original maps that show the routes they take through...
Balanced Assessment
Blirts and Gorks
Start a trend by using blirts and gorks as your standard unit of measures. The activity asks learners to take a known measures of blirts and gorks and develop a conversion ratio. Individuals use both perimeter and area measures of...
Achieve
Corn and Oats
How much land does a parcel hold? How much fertilizer does it take for a field of corn? Pupils answer these questions and more as they apply ratio reasoning and unit analysis.
Curated OER
Candy Bars
There is often more to data than meets the eye. Scholars learn that they need to analyze data before making conclusions as they look at data that describes the number of candy bars boys and girls eat. They disprove a given conclusion and...
Balanced Assessment
Greater, Lesser, In-Between
Goldilocks and the Three Numbers? The pre-activity task involves finding digits to complete decimals or fractions that satisfy given constraints, such as finding a fractions that is in between two others. The main task involves a similar...
Balanced Assessment
Genetic Codes
Determine the number of possible genetic codes. Class members are challenged to determine the number of possibilities of a genetic code that is 20 bases long. They continue to explore the average lengths of broken RNA molecules.
Balanced Assessment
Books from Andonov
To examine mathematical functions in a modeling situation pupils combine quadratic and step functions to represent a presented scenario. They both graph and write a function to represent data shown in a table.
Balanced Assessment
Melons and Melon Juice
Model the difference between the graphs of discrete and continuous functions. Scholars examine two scenarios and construct graphs to model the situation. They then compare their graphs that illustrate the subtle difference between these...
Balanced Assessment
L to Scale
Explore the meaning of scale in relation to actual size through this activity. Young mathematicians examine scale models and determine their relationship to each other. They also find perimeter and area of each model.
Education Development Center
Interpreting Statistical Measures—Class Scores
Explore the effect of outliers through an analysis of mean, median, and standard deviation. Your classes examine and compare these measures for two groups. They must make sense of a group that has a higher mean but lower median compared...


