Desmos
Desmos Graphing Calculator
They say a graph is worth a thousand points. The interactive allows users to graph a wide variety of functions and equations. Using the included keyboard or typing directly into the list, learners determine the graph of a function....
Concord Consortium
Broken Spreadsheet I
There is power in spreadsheet formulas and learners use this power to model quadratic data. Given a scatterplot of a parabola, pupils create formulas in a spreadsheet to populate the data. The formulas they use lead to an understanding...
CCSS Math Activities
Smarter Balanced Sample Items: High School Math – Claim 4
What is the appropriate model? Sample problems show the extent of the Smarter Balanced assessments Claim 4, Modeling and Data Analysis. Items provide pupils the opportunity to use mathematical modeling to arrive at a reasonable answer....
PHET
Least-Squares Regression
Less is best when looking at residuals. Scholars use an interactive to informally fit a linear regression line to data on a scatter plot. The interactive provides a correct best fit line with residuals and correlation coefficient to...
Alabama Learning Exchange
The State Capital of Stem and Leaf
Students explore the concept of stem and leaf plots. In this stem and leaf plots lesson, students plot the 50 US states' capitals on a stem and leaf plot according to the first letter of each state. Students compare their stem and leaf...
Curated OER
Linear and Exponential Models
Learners linearize data to determine if an exponential model is suitable. For this linearizing data to determine if an exponential model is suitable lesson, students graph the residuals of sets of data that appear to have an exponential...
Curated OER
Perimeter Pattern
High schoolers investigate perimeter patterns formed by a hexagon and a triangle. They will identify the dependent and independent variable and write a function for the relationship.
Curated OER
Leonardo da Vinci
Students select appropriate tools and technology to perform tests, collect data, and display data. They construct appropriate graphs from data and develop qualitative statements about the relationships between variables.
Curated OER
Word Problems: "Leaving D.C."
In this solving math story problems worksheet, students read statistics from the Student edition of USA Today to solve word problems. Students solve 6 problems.
Curated OER
Geometric Sequences and Series
Learners find common ratios of geometric sequences on a spreadsheet. Using this data, they create scatter plots of the sequences to determine how each curve is related to the value of the common ratio. They will consider whether series...
Beyond Benign
Water Bottle Unit
How much plastic do manufacturers use to create water bottles each year? The class explores the number of water bottles used throughout the years to determine how many consumers will use in the future. Class members compare different...
American Statistical Association
Speedster
Catch me if you can. Scholars collect data on reaction time by catching a falling ruler or by using an Internet app. They determine the median of the data, create graphs, and analyze the results. They also compare their data to the rest...
Radford University
Marketing Mayhem: Advertising for Adolescents
You'll be sold on using the resource. Future consumers first conduct a sample survey on marketing strategies. They then consider how mass media influences their age groups and create presentations to display their findings.
101 Questions
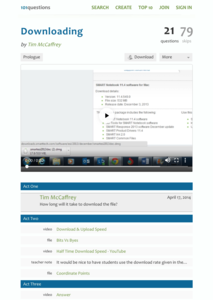
Downloading
Have you ever wanted to download a great lesson, but you weren't sure if you had enough time? Scholars learn to create a function for this situation to determine when a file will finish downloading. They also learn the difference between...
Radford University
Animal Decline
Where did they all go? Small groups collect data on different animal species that are on a decline. Teams develop equations to model the populations over time and then create presentations about the decline of their animals. Classmates...
Curated OER
Lessen the Loan
Middle-schoolers explore the concept linear equations. They use the internet to navigate through videos and problems. Pupils problem solve to determine rates of change, slope, and x and y-intercepts.
Curated OER
Statistical Accuracy and Reliability
Ninth graders assess the accuracy and reliability of current survey data and how it is represented. They design a survey, collect data, and use technology to analyze the data and present the results. Students examine scatter plots and...
Curated OER
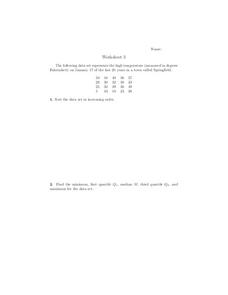
Scatterplots
In this scatterplots worksheet, 9th graders solve and complete 6 different word problems with different sets of data. First, they sort the data set in increasing order and find the minimum, first quartile, median, third quartile, and...
Curated OER
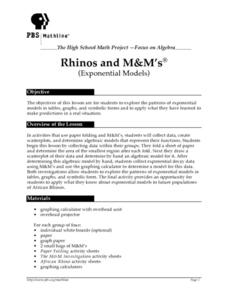
Rhinos and M&M's
Students analyze patterns of exponential models by collecting data in paper folding and M&M investigations. They use graphing calculators to create scatter plots that lead to equations for the exponential models. They then apply this...
Curated OER
Measuring Mania
Students rotate through stations in the classroom, completing different types of measurements. These measurements are placed into a spreadsheet, and a scatter plot is generated. They type an explanation of their results in correlation...
Curated OER
Best Guesser
Fifth graders develop strategies for estimating ages, and illustrate results by graphing and interpreting scatter plots to compare x and y coordinates.
Curated OER
M&M Exponential Activity
Students create a scatter plot of their experimental data. In this algebra lesson, students use M&M's to determine an algebraic model. They discuss results in class.
Statistics Education Web
The United States of Obesity
Mississippi has both the highest obesity and poverty rate in the US. Does the rest of the data show a correlation between the poverty and obesity rate in a state? Learners tackle this question as they practice their skills of regression....
CCSS Math Activities
Smarter Balanced Sample Items: 8th Grade Math – Claim 4
A math model is a good model. A slide show presents 10 sample items on modeling and data analysis. Items from Smarter Balanced illustrate different ways that Claim 4 may be assessed on the 8th grade math assessment. The presentation is...


