Curated OER
Curved Lines
In this curved lines worksheet, students examine equations that, when graphed, present a curved line. They explore specified points on the graphed line and write an equation for the tangent line at given points. This two-page worksheet...
Curated OER
Exploring and Using Shapes to Make a Dance
Second graders use their bodies to create various shapes to make a dance when given various music and beats. In this shapes and dance lesson plan, 2nd graders create lines, curves, twists, and angles with their bodies.
CK-12 Foundation
Broken-Line Graphs: Heating Curve of Water
Examine the unique graphs coined broken-line graphs. Using the phase change of water for data, learners answer questions related to the temperature and energy at different times in the cycle of the phase change. Questions focus on the...
Curated OER
Length of a Curve
In this curved lines worksheet, students measure the length and answer questions about curved lines. Students complete 6 short answer questions.
Virginia Department of Education
Linear Curve of Best Fit
Is foot length to forearm length a linear association? The class collects data of fellow scholars' foot length and the length of their forearms. They plot the data and find a line of best fit. Using that line, they make predictions of...
Virginia Department of Education
Line of Best Fit
Pupils work through a guided activity on fitting a linear equation to a set of data by entering the data into a calculator and trying to envision a line of best fit. They then have the calculator determine the least-squares line and...
CK-12 Foundation
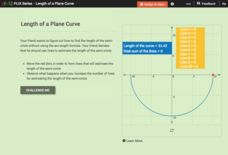
Length of a Plane Curve
Challenge your class to use straight lines when estimating the length of a curve. An engaging interactive allows individuals to place line segments one after another along the arc. Learners determine that the more lines used, the better...
Illustrative Mathematics
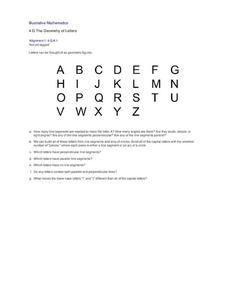
The Geometry of Letters
Use the alphabet as a tool for teaching your class about geometric figures. Break apart capital letters into line segments and arcs. Classify angles as right, acute, or obtuse. Identify parallel and perpendicular lines. An excellent...
Curated OER
Scatter Diagrams and Curve Fitting
In this Scatter Diagrams and Curve Fitting worksheet, students are guided in how to graph a scatter diagram (plot) and a Best Fit Line using a TI-83 graphing calculator.
Curated OER
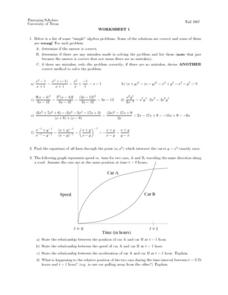
Worksheet 1 - Equation of a Line
For this equation of a line worksheet, students determine the equation of a line, use the distance formula to identify the relationship between two moving objects, and solve inequalities algebraically. This two-page worksheet contains...
Balanced Assessment
On Averages and Curves
Determine the average on a curve. The class finds graphical representations of averages and expresses them both symbolically and on the graph. The assessment requires class members to justify using average to describe graphs.
Curated OER
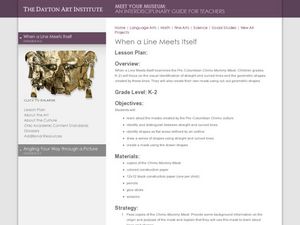
When A Line Meets Itself
Students investigate the linear characteristics of cultural art. In this art analysis lesson, students discover the Pre-Columbian Chimu culture and the many masks they created. Students identify the different shapes and lines in their...
Curated OER
Areas Under Curves: An Astronomical Perspective
In this area under the curve activity, students use a graph of the number of exoplanets discovered and the year they were discovered to solve 5 problems. Students find the total area under the curve, they find the total number of planets...
Curated OER
Area of Curve
In this calculus worksheet, students calculate the area of a curve bounded between two regions. There are 2 questions asking for the area and length of a curve.
Curated OER
Everyday Heroes You Can Be One, Too
Students listen to a read aloud of Alan Baker's, White Rabbit's Color Book while identifying shapes and lines throughout the book. They use shapes and different types of lines to create a bunny of their own. They must use five shapes to...
Radford University
Can I Create a Line/Curve of Best Fit to Model Water Drainage?
Learners collect data on the amount of water left in a bottle over time. They graph the data to determine whether the scatter plot shows a curved or straight relationship. Group members then determine an equation for the curve of best...
Curated OER
Line and Shape Game
Students play the "space-breaker" game, in which they are required to create a picture using shapes or lines called out to them) to reinforce the concept of geometric shape and line.
Curated OER
Lines of Best Fit
Students explore the concept of line of best fit. In this line of best fit lesson, students find lines of best fit in examples about riding your bike home from school and dentistry. Students find two data points and find the line of best...
Curated OER
Lines of Best Fit
Students determine if there is an associationm in a scatter plot of data. They analyze data through predictios, comparisons, and applications. Students calculate the line of best fit using a graphing calculator. They display data in...
Curated OER
Functions and the Vertical Line Test
Students explore the concept of functions. In this function lesson, students determine if the graph is a function by using the vertical line test. Students use an applet to explore the vertical line test on a variety of graphs.
Shodor Education Foundation
Data Flyer
Fit functions to data by using an interactive app. Individuals plot a scatter plot and then fit lines of best fit and regression curves to the data. The use of an app gives learners the opportunity to try out different functions to see...
Curated OER
Introduction to Tangent Lines using the TI-Nspire
Learners make mathematical argument using the concept of Limit. In this algebra lesson plan, student calculate the instantaneous rate of change from the linear graph. They use a TI-calculator to create a visual of the graphs.
Curated OER
Secrets of Painting
Students explore colors and shapes. In this art concepts lesson, students discuss shapes, lines, and color while creating a variety of abstract designs. The instructions for several art activities are provided. Basic art vocabulary and a...
Curated OER
Fancy Foot- Estimating Whether a Line is Longer or Shorter Than a Foot
In this fancy foot estimation and measurement activity, 1st graders examine 3 curved lines and estimate whether they are longer or shorter than a foot. They use a foot-long string to check each answer.
Other popular searches
- Straight and Curved Lines
- Measure Curved Lines
- Measuring Curved Lines
- Printing Practice Curved Lines


