Curated OER
Data Analysis
In this data analysis learning exercise, 9th graders solve and complete 8 different problems. First, they add each of the matrices shown at the top. Then, students subtract the matrices. They also multiply and simplify the given expression.
Curated OER
wordsnake- Word Puzzle- Data
In this wordsnake puzzle worksheet, learners locate words that are associated with data. They start at an arrow on the page, and work their way across and down, but not diagonally, through a grid. They locate one word attached to another...
Curated OER
Interpreting Data
In this math problem solving worksheet, students read a story problem and interpret the data presented in order to respond to 4 questions.
Curated OER
Completing frequency diagrams from displayed data
In this frequency worksheet, students use data in graphs and charts to complete a frequency diagram. Students fill in 26 spaces in the diagram.
EngageNY
Describing Center, Variability, and Shape of a Data Distribution from a Graphical Representation
What is the typical length of a yellow perch? Pupils analyze a histogram of lengths for a sample of yellow perch from the Great Lakes. They determine which measures of center and variability are best to use based upon the shape of the...
Federal Reserve Bank
FRED in the Classroom: Employment and the Labor Force
Acquaint your class members with data sources for employment in the United States and help them gain a better understanding of a vital measure of our economy's health.
Curated OER
Survey of Height
For this data collection worksheet, learners survey the heights of their fellow classmates, organize their data in a data table, and create a bar graph from their data. Once bar graph is completed, students complete 2 short answer...
University of Georgia
Freezing and Melting of Water
Examine the behavior of energy as water freezes and melts. An engaging activity provides a hands-on experience to learners. Collaborative groups collect data and analyze the graphs of the temperature of water as it freezes and then...
EngageNY
Comparing Distributions
Data distributions can be compared in terms of center, variability, and shape. Two exploratory challenges present data in two different displays to compare. The displays of histograms and box plots require different comparisons based...
Beyond Benign
Can You Hear Me Now? Cell Phone Accounts
How sustainable are cell phones? Throughout the unit, learners explore the issues around cell phones concerning sustainability. Class members take a graphical look at the number of cell phones across the world using a box-and-whisker...
Bowland
Tuck Shop
Correct a misleading conclusion. Individuals review a set of data and a conclusion to determine what is wrong with the conclusion. Pupils then represent the data with an appropriate display. Finally, learners develop a correct conclusion...
CK-12 Foundation
Understand and Create Histograms: Car Sales
Create a history of car sales. Pupils create a histogram/bar graph to show the number of car sales made during the week. Using the data display, learners calculate numerical summaries of the data and find the percent of cars sold during...
CK-12 Foundation
Mode: Boxes of Oranges
See how your data stacks up. Pupils stack crates of oranges in increasing order, creating a simple bar graph. Using the graph, individuals determine measures of center and describe the shape of the distribution. Scholars determine what...
Virginia Department of Education
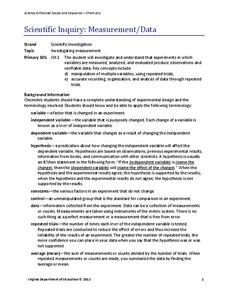
Scientific Inquiry: Measurement/Data
While pupils design their own lab experiments, they will not form a new species. Scholars take their materials and design an experiment regarding reaction rates.
Corbett Maths
The Mode
Most frequently prefer the mode. The resource defines the mode and shows how to determine it in a data set. Using another type of problem, the video develops a data set with a given mode and number of data points.
Curated OER
Identifying Ozone Variations over Different Locations
Learners analyze ozone data. In this atmosphere lesson, students will use a NASA resource to gather data for different regions of the Earth. Learners will then create a graph for their data and answer related questions.
Curated OER
Red Worms Rock!
Second graders measure red worms. In this lesson, 2nd graders observe and collect data on red worms. Students measure the red worms and create a graph with the data they collect.
EngageNY
Sampling Variability in the Sample Mean (part 1)
How accurate is data collected from a sample? Learners answer this question using a simulation to model data collected from a sample population. They analyze the data to understand the variability in the results.
Concord Consortium
People and Places
Graph growth in the US. Given population and area data for the United States for a period of 200 years, class members create graphs to interpret the growth over time. Graphs include population, area, population density, and population...
Curated OER
A Day at the Beach
Help learners determine the rate of change for the temperature of sand. They will collect data on the temperature of wet and dry sand over time with a heat lamp overhead. Then make a scatter plot of the data and find a linear model to...
Curated OER
Exploring Seasonal Shadows and Sunlight
What can shadows tell us about the changing season? Over several months, astronomy learners record length and position of an outdoor object's shadow, such as a flagpole. They apply the data to a growing hypothesis and note the patterns...
Curated OER
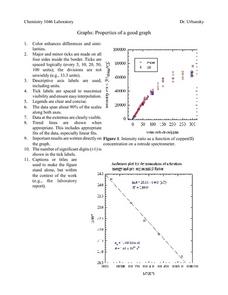
Properties of a Good Graph
For this chemistry worksheet, students examine the common characteristics of an acceptable graph that is meant to be used to display data.
PBL Pathways
Doctors and Nurses
How many nurses does it take to support one doctor? A project-based activity asks learners to analyze state data to answer this question. Classes create polynomial functions from the data of doctors and nurses over a seven-year period....
Teach Engineering
Building-Testing-Improving Paper Airplanes: Head's Up!
Take foldables to all new heights. Pupils build and fly different types of paper airplanes in the 14th portion of a 22-part unit on aviation. Groups collect data on distance and flight time for each plane and compare the data from the...
Other popular searches
- Data, Census, & Statistics
- Data Collection
- Collecting Data
- Graphing Data
- Data Analysis Pictograph
- Categorical Data
- Data Tables
- Databases
- Data Analysis Lesson Plans
- Data Management
- Data Analysis Graphing
- Access Database


