Curated OER
Choose The Appropriate Graph
Fifth graders work in groups to investigate the proper use of a graph during a schoolyard ecology project. The challenge of the project is for students to choose the proper form of a graph. They gather data and conduct analysis with the...
Curated OER
ABC Data Sheet
Ever wonder why your special-needs or autistic learners have out bursts in class? Use this ABC Data collection sheet to determine the antecedent, behavior, and consequence to help you determine a possible function for your student's...
Beyond Benign
Plastic Bags
Paper or plastic? Explore the environmental effects of using plastic bags through mathematics. Learners manipulate worldwide data on plastic bag consumption to draw conclusions.
Curated OER
Hand Lotion Analysis
Students prepare a sample of a commercial hand lotion for analysis by HPLC to determine the percent composition of two common cosmetic preservatives, methylparaben and propylparaben. They perform the analysis and the data is evaluated to...
Curated OER
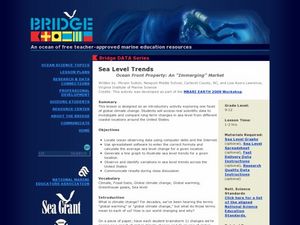
Sea Level Trends ~ Ocean Front Property: An "Immerging" Market
Young oceanographers take a look at sea level data from several cities over a few centuries. They use the data to fuel a discussion about what kind of changes are taking place and the impact they are having on the coastal ecosystems....
Curated OER
Data Analysis
Twelfth graders collect and analyze data. In this secondary end-of-course mathematics lesson, 12th graders formulate a question they would like to answer and decide on an appropriate means of data collection. Students present their...
Curated OER
Visual Communication of Quantative Data
Students collect and analyze data based on academic performance. In this statistics lesson, students create graphs and analyze the data they created. They use positive, negative and no correlation to analyze the data.
Curated OER
Ocean Exploration: How Doea you Data Grow? (Grades 7-8)
Learners explore fieldwork. In this seventh or eighth grade mathematics lesson plan, students watch a video on data collection in the field. Learners use fieldwork to gather data about their school environment. Students compile data...
Curated OER
Data Clusters and Distributions
Young scholars explore the concept of data clusters. For this survey information lesson, students watch an episode of "Cyberchase" and then discuss the pros and cons of conducting surveys and reading their results.
Curated OER
TV Survey - Data Collection and Analysis
In this data collection and analysis worksheet, 4th graders complete a tally chart about the number of hours that fourth graders watch television. They create a bar graph with the information, write a paragraph about the survey results,...
Curated OER
Data Collection and Graphing
Students collect data and graph it on a coordinate plane and analyze it. In this statistics lesson, students display their data collection using a graph. They determine which central tendency will work best.
Curated OER
Excel Turns Data Into Information
Learners use excel to analyze data. In this technology lesson, students enter data into the excel program to find averages and organize data.
Curated OER
Collect and Organize Data: Reteach
In this data collection worksheet, students learn the parts of a tally chart and how it organizes information. Students then use the second tally chart to help them answer the six questions.
Virginia Department of Education
Numbers in a Name
What's in a name? Pupils create a data set from the number of letters in the names of classmates. Each group then takes the data and creates a visual representation, such as a histogram, circle graph, stem-and-leaf plot, etc.
Albert Shanker Institute
Economic Causes of the March on Washington
Money can't buy happiness, but it can put food on the table and pay the bills. The first of a five-lesson unit teaches pupils about the unemployment rate in 1963 and its relationship with the March on Washington. They learn how to create...
Curated OER
Examine the Data
Seventh graders examine a teacher-created database and identify specific variables and develop hypothesis statements as to their possible effect. They create a summary statement either proving or disproving their hypothesis.
Statistics Education Web
The United States of Obesity
Mississippi has both the highest obesity and poverty rate in the US. Does the rest of the data show a correlation between the poverty and obesity rate in a state? Learners tackle this question as they practice their skills of regression....
Statistics Education Web
Walk the Line
How confident are you? Explore the meaning of a confidence interval using class collected data. Learners analyze data and follow the steps to determine a 95 percent confidence interval. They then interpret the meaning of the confidence...
Messenger Education
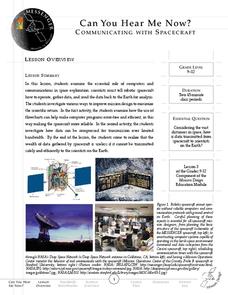
Can You Hear Me Now?—Communicating with Spacecraft
Radio signals transmitted to Pluto take five hours to reach their destination! In these two activities, young scientists explore data communication in space. In activity one, pupils learn how data is gathered and sent back to Earth....
EngageNY
Interpreting Residuals from a Line
What does an animal's gestation period have to do with its longevity? Use residuals to determine the prediction errors based upon a least-square regression line. This second lesson on residuals shows how to use residuals to create a...
NOAA
Graphing Temperatures
Battle of the hemispheres? In the fourth installment of a five-part series, young oceanographers use the NOAA website to collect temperature data from drifters (buoys), one in the Northern Hemisphere and one in the Southern Hemisphere....
Chicago Botanic Garden
Preparing for Project BudBurst
Plants take cues from the environment—change in daylight hours and temperature—to complete their seasonal life cycles. Lesson four in the series of six has classes collect phenology data on plants. After taking initial observations,...
Curated OER
Mrs. Lewis's Pets: Tally Mark Activity
To cute to pass up! This slide show activity has learners count the number of pets Mrs. Lewis has using tally marks. As the show progresses, kids pay attention and make a tally for each type of pet they see. Suggested uses and audio are...
Positively Autism
Handwashing Task Analysis Data Sheet
Turn on water, put hands in the water, pump soap. Keep track of a learners' steps to independence with a handwashing task analysis sheet that lists nine observable behaviors that can be rated.
Other popular searches
- Data, Census, & Statistics
- Data Collection
- Collecting Data
- Graphing Data
- Data Analysis Pictograph
- Categorical Data
- Data Tables
- Databases
- Data Analysis Lesson Plans
- Data Management
- Data Analysis Graphing
- Access Database


