Curated OER
Wind Effects- A Case Study
Learners explore hurricanes. In this weather data interpretation lesson, students draw conclusions about the impact of Hurricane Floyd as it related to weather conditions. Learners read and interpret a tide data table, a barometric...
Curated OER
Using Bar Graphs to Understand Voting Patterns
Bar graphs are used as a way to study voting patterns in the United States. A variety of statistical data is presented in the graphs, and pupils must interpret the data in order to make a report to the class. Three excellent graphs,...
EngageNY
Random Sampling
Sample pennies to gain an understanding of their ages. The 16th installment of a 25-part series requires groups to collect samples from a jar of pennies. Pupils compare the distribution of their samples with the distribution of the...
Curated OER
Cover Up: Tools for Integrating Math and Engineering
Blend art, adolescent snacking habits, and math to create new cereal boxes. Secondary learners review scale drawings. They use this information to construct cereal boxes to scale and will compare their creation to the original product to...
Curated OER
Understanding the 1855 Census Database
Use data from the 1855 New York census to better understand the Irish immigrant experience during the late 19th century. Young historians analyze information from the census and build three hypotheses regarding the residents of the Five...
Curated OER
Reading Bar Graphs
Working on bar graphs in your math class? Use a thorough worksheet to reinforce graphing and problem solving skills with your third graders. After reviewing two bar graphs, young learners answer ten questions about the data represented...
John F. Kennedy Presidential Library & Museum
Red States/Blue States: Mapping the Presidential Election
Young historians investigate how voting patterns have changed by comparing the outcome of the 1960 election to the outcome of the recent election. A creative final assessment has participants making a news show wherein they provide...
Curated OER
Bloodstain Pattern Simulations: A Physical Analysis
Students receive bloodstain pattern evidence from a crime scene. They answer a series of questions through inquiry, observation, measurement, and analysis. Pupils complete this challenge, by reconstructing the evidence through four...
Curated OER
A world of oil
Students practice in analyzing spatial data in maps and graphic presentations while studying the distribution of fossil fuel resources. They study, analyze, and map the distribution of fossil fuels on blank maps. Students discuss gas...
C-SPAN
Why Do Americans Not Vote in Elections?
In an age of inflamed politics, who votes, who doesn't vote, and why are the questions everyone is trying to answer. Pupils listen to scholars, journalists and data crunchers on voting statistics to make their own conclusions. A chart...
Curated OER
Solving Real Life Problems
How do you solve a real-world math problem? Start by thinking about the five steps to good problem solving, which include reading, extracting data, choosing a calculation, showing work, and stating a solution. Well done!
Magic of Physics
Shadows
Sunrise, sunset ... swiftly move the shadows! Pupils practice comparing shadow length data with a hands-on activity. The resource allows users to examine and measure the shadow cast by a stick as the sun moves overhead before testing...
Pingry School
An Introduction to Qualitative Analysis
Compounds take on different properties than their elemental components. How can scientists determine those elements? A lab-based activity has learners explore several double replacement reactions to analyze compounds qualitatively. They...
Curated OER
Data Record Plant Observation
In this recording data worksheet, learners draw and describe their observations of a plant on a chart. Students describe three observations.
Curated OER
Building Brilliant Bar Graphs
Everything you need for a mini-unit on bar graphs is included in this lesson plan! It outlines three lessons and includes worksheets. Learners taste pretzels, shoot baskets (switching off hands), and grab candy, graphing results...
National Wildlife Federation
Why All The Wiggling on the Way Up?
Some of the CO2 emitted by burning fossil fuels is removed from the atmosphere by natural sinks, such as the ocean. The fifth engaging lesson in the series of 21 examines the CO2 data from three very different locations. It then makes a...
National Wildlife Federation
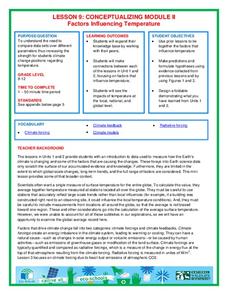
Conceptualizing Module II - Putting It All Together
"Creativity is just connecting things." - Steve Jobs. After weeks of researching climate change, the ninth lesson in a series of 21 combines the data and analysis to address essential questions. It covers natural phenomenon, human...
National Wildlife Federation
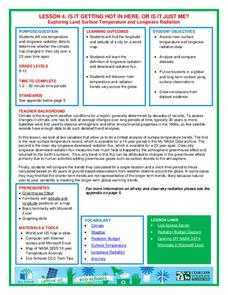
Is It Getting Hot in Here, or Is It Just Me?
Currently, only 2.1% of global warming is felt on continents, while over 93% is felt in the oceans. The fourth lesson in the series of 21 on global warming is composed of three activities that build off one another. In the first...
Curated OER
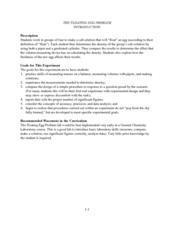
The Floating Egg Problem
This is the grown-up version of the classic "float an egg in salt water" experience, plus an experiment in soap making. High schoolers explore density, but more importantly, practice accuracy, precision, and the use of significant...
Curated OER
Strict Parents
Are your parents or guardians strict? That's an interesting question many of your pupils are probably interested in discussing. How do you design a study directed at your high schooler to gain insight into that question? How do you...
Curated OER
8.SP.1Texting and Grades I
Here is a fitting question for middle schoolers to consider: Is there a relationship between grade point average and frequency of sending texts? Starting statisticians examine a scatter plot and discuss any patterns seen.
Howard Hughes Medical Institute
EarthViewer
Can you imagine Washington DC and London as close neighbors occupying the same continent? Learners will be fascinated as they step back in time and discover the evolution of the earth's continents and oceans from 4.5 billion years ago to...
American Psychological Association
A Tasty Sample(r): Teaching about Sampling Using M&M’s
Here's a sweet activity! As part of a study of psychological research methods and statistic gathering, individuals develop a hypothesis about the number of each color of M&Ms in a fun-size package. They then count the number of each...
Chicago Botanic Garden
Micro-GEEBITT Climate Activity
A truly hands-on and inquiry based learning activity bridges all the lessons in the series together. Beginning with a discussion on average global temperatures, young meteorologists use real-world data to analyze climate trends in order...
Other popular searches
- Data, Census, & Statistics
- Data Collection
- Collecting Data
- Graphing Data
- Data Analysis Pictograph
- Categorical Data
- Data Tables
- Databases
- Data Analysis Lesson Plans
- Data Management
- Data Analysis Graphing
- Access Database


