Perkins School for the Blind
The Mystery Box - Making Observations and Collecting Data
Making observations and collecting qualitative and quantitative data is a vital skill all scientists need to practice. Help your scientists with partial and no sight learn how to use their other senses to make observations for...
Office of the New Jersey State Climatologist
Play Ball! – Or Not…Making a Decision Using Weather Data
Should the game go on or not? An engaging instructional activity asks small groups to make a decision using weather data. After analyzing a map, an updated forecast, and radar information, groups have to decide whether to cancel a...
Kenan Fellows
Applying Linear Regression to Marathon Data
It's not a sprint, it's a marathon! Statistic concepts take time to develop and understand. A guided activity provides an opportunity for individuals to practice their linear regression techniques in spreadsheet software. The activity...
Curated OER
Quantitative Data
In this quantitative data worksheet, pupils compute measures of central tendency, draw vertical line diagrams, and compare collected data. This 23-page worksheet contains approximately 100 multi-step problems. Explanations and examples...
K12 Reader
Displaying Data
It's important to learn how to display data to make the information easier for people to understand. A reading activity prompts kids to use context clues to answer five comprehension questions after reading several paragraphs about...
EngageNY
Modeling a Context from Data (part 1)
While creating models from data, pupils make decisions about precision. Exercises are provided that require linear, quadratic, or exponential models based upon the desired precision.
Mathed Up!
Stem and Leaf Diagrams
Order the data within a stem-and-leaf display. Pupils take data and create and ordered stem-and-leaf diagrams, including the key. Participants take their data and determine answers about the information. Class members then find...
Curated OER
Multi-dimensional Modeling of Ore Bodies Making Sense of Empirical Data
Math scholars identify four different rock types in that strata and use this identification and data to construct a two dimensional geologic cross-section. They use data tables to construct a three-dimensional geologic cross-section.
Curated OER
A Comparison Study of Water Vapor Data to Precipitation over North America
Students use NASA satellite data to compare water vapor over the United States. In this data analysis lesson students use an Excel spreadsheet to map their data.
Curated OER
Representing Data 1: Using Frequency Graphs
Here is a lesson that focuses on the use of frequency graphs to identify a range of measures and makes sense of data in a real-world context as well as constructing frequency graphs given information about the mean, median, and range of...
Curated OER
Sound Walk: Discovering Data and Applying Range, Mode, and Mean
Elementary schoolers sharpen their listening skills as they use sound maps, tallies, and line plots to organize and interpret data. Everyone takes a "sound walk," and focuses on the sounds around them. They chart and tabulate the sounds...
Shodor Education Foundation
Data Flyer
Fit functions to data by using an interactive app. Individuals plot a scatter plot and then fit lines of best fit and regression curves to the data. The use of an app gives learners the opportunity to try out different functions to see...
Howard Hughes Medical Institute
Spreadsheet Tutorial 2: Autofill Data, Cell References, and Standard Deviation
If you've always wanted to know more about spreadsheets, here's a perfect resource for you. A self-paced tutorial introduces how to autofill and copy formulas in a Google sheet or Excel spreadsheet. It also shows users how to find range,...
Curated OER
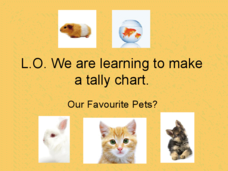
Pet Tally
Give the class an opportunity to practice using tally marks as a way to collect data. As you progress through the slide show, learners tally up the number and types of pets they see, they then use their data to create a tally chart....
Curated OER
Reading Bar Graphs #2
Raise the bar in your third grade class with this learning exercise on bar graphs. Youngsters view three graphs representing three different sets of data, and answer questions based on what they analyze. The first set is completed as an...
Charleston School District
Two-Way Tables
Do males or females buy more iPhones? Using a two-way frequency table can help to answer this question. Pupils learn to create two-way frequency tables and then how to analyze the data within the tables. Learners find frequencies,...
Curated OER
Reading Bar Charts
Help kids understand how to collect data through surveys, organize data in a bar chart, then analyze their findings. There are three different surveys for learners to conduct, a full description of all the parts of a bar chart, and three...
Curated OER
Graphs
For beginners to picture graphs this is the perfect resource. They analyze two bar graphs that break down data visually so scholars can actually count the number in each column. For the first, they fill in how many of each type of pet is...
Curated OER
Tables
Can you read this table? Learners begin to comprehend data analysis through examining two simple tables and answering comprehension questions. The first gives characteristics about three animals in yes-or-no format (i.e. "eats insects,"...
Curated OER
What's Your Favorite Fruit?
A sweet activity to challenge your first graders! The picture graph displays a class's favorite fruits. Young learners solve various problems with the data, including counting the amounts of each kind of fruit, and interpreting which...
NASA
Observing Monsoon Weather Patterns with TRMM Data
Follow a fabulous slide show on how monsoons form and how satellite technology is being used to observe the phenomena, explaining why they occur. Afterward, visit the TRMM (Tropical Rainfall Measuring Mission) website to access actual...
Virginia Department of Education
Safety and the Material Safety Data Sheet
While many chemicals are used in biology class, many pupils don't understand the material safety data sheets. The lesson explains each part and the importance of understanding the forms. Young scientists use safety equipment to ensure...
Curated OER
Bar Graphs and Pictographs
How are bar graphs and pictographs different? As you begin this concept, use these simple graphs to help get learners started with data analysis styles. There is one bar graph and one pictograph, each accompanied by four or five...
Curated OER
World Oil Reserves: Assignment
Understanding and analyzing data is a critical skill. Included here are three worksheets a list of countries with the largest oil reserves, a graph of the same, and an assignment. The class uses their data to create a bar chart then...
Other popular searches
- Data, Census, & Statistics
- Data Analysis Pictograph
- Data Table
- Categorical Data
- Data Analysis Lesson Plans
- Data Management
- Data Analysis Graphing
- Data Analysis and Graphs
- Science Fair Project Data
- Data Display
- Organizing Data
- Census Data


