Curated OER
Exploring Seasonal Shadows and Sunlight
What can shadows tell us about the changing season? Over several months, astronomy learners record length and position of an outdoor object's shadow, such as a flagpole. They apply the data to a growing hypothesis and note the patterns...
Curated OER
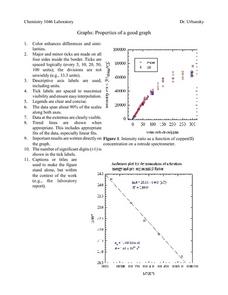
Properties of a Good Graph
For this chemistry worksheet, students examine the common characteristics of an acceptable graph that is meant to be used to display data.
American Statistical Association
How Long Are the Words in the Gettysburg Address?
It's 268 words, but one only needs to consider 10 of them at a time. A data collection and analysis activity has learners investigate the lengths of words in the Gettysburg Address. They first self-select a sample of 10 words and...
Curated OER
It's Your Life - Safe or Sorry/Safety Issues
Students examine and chart data about safety hazards and unsafe situations. In this safety hazard lesson, students examine newspapers and web sites to investigate injuries from safety hazards. They make a spreadsheet using the data and...
Curated OER
Residential Power System
Perform data analysis on energy consumption to apply algebraic expressions to the real world. Learners will write and solve equations that answer various questions from residential power use. They will collect data at home and calculate...
Virginia Department of Education
Field Goals, Balls, and Nets
Score a resource on ratios. Young mathematicians learn about different ways to express ratios. Using sports data, they write statements about the statistics in ratio form.
PBS
Investigating Seasonal Temperature and Precipitation Variations
Weather seems unpredictable, but is it really? Learners collect weather data from online interactives and build data displays. They use their displays to identify temperature and precipitation patterns in different areas.
American Statistical Association
A Tale of One City and Two Lead Measurements
Lead the way in learning about lead contamination. Pupils first read several articles about the Flint water crisis and the EPA's rules for lead concentration. They use provided data from 71 Flint water wells to compute the 90th...
Annenberg Foundation
Skeeters Are Overrunning the World
Skeeters are used to model linear and exponential population growth in a wonderfully organized lesson plan including teachers' and students' notes, an assignment, graphs, tables, and equations. Filled with constant deep-reaching...
Curated OER
Physical Science: Festival of Bubbles
Investigate bubbles through the use of scientific inquiry. Pupils blow bubbles using several methods and measure the resulting bubble print. Measurements are recorded on a data table and transferred to a bar graph. Results are discussed...
Curated OER
How Big is the Playground: Creating a Map
Students create a topographical map of an area outside of the school. In this mapping instructional activity, students compile data on angles, distances, and key landmarks for a predetermined area on the school grounds to create a map...
EngageNY
Evaluating Reports Based on Data from an Experiment
They say you can interpret statistics to say what you want them to. Teach your classes to recognize valid experimental results! Pupils analyze experiments and identify flaws in design or statistics.
NASA
Using Models in Climate Change Research
Explore models through the relevant lens of climate change! Investigators watch a video about using models and their application for evaluating temperature data and climate change. Scientists read an article on climate change and answer...
Anti-Defamation League
60 Years Later: The Legacy of Brown v. Board of Education
Although the 1954 U.S. Supreme Court decision Brown v. Board of Education declared segregated schools unconstitutional, huge inequalities still exist in U.S. public schools. Learners analyze and discuss data presented in two...
Curated OER
Fishy Behavior
Here's a lab that may make you rethink that morning cup of coffee. Biology scholars test the effects of caffeine, alcohol, and nicotine on the behavior of zebrafish through an intriguing experiment. Learners observe fish behavior before...
American Statistical Association
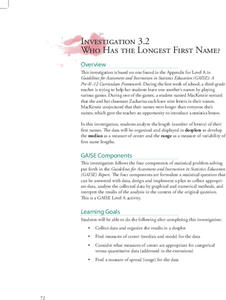
Who Has the Longest First Name?
Name that statistic! Classmates each write their name and the number of letters in it on a sticky note to place on the board. As a class, they determine the median, mode, and range of the name lengths, and create a dot plot of the data....
C-SPAN
Survey Analysis- Public Perceptions of Voting and Elections
The perception of fairness in elections becomes more important with each passing election. Using data from a C-SPAN poll, budding historians consider the differences between how people perceive elections. The resource includes videos of...
Curated OER
Collecting Data and Graphing
Young mathematicians collect data and graph it. They work collaboratively to collect data regarding the span of arm length versus height and graph the data they collect.
Curated OER
What's Up With My Class
Learners collect data about their class and they use Excel spreadsheet to display their tables and graphs about the class. They answer survey questions and collect their data. Students create a graph of their choice to display the...
Curated OER
Data Analysis and Probability
Students design models to simulate actual events using various random devices. They estimate the likelihood of a particular outcome using results of simulation. In addition, they simulate the births of three children to a using a coin.
Curated OER
Populations Lab - Cultures Lesson: Statistics / Sampling Patterns
Ninth graders examine the application of statistical sampling, data collection, analysis, and representation that exists in schooling and teenage lifestyles in Japan and the United States.
American Institutes for Research
Digital Smiles
Explore metric measurement, recording data, and creating an electronic spreadsheet displaying results with your math class. Scholars will measure the length of their smiles, record the measurements, and represent the results on an...
Bowland
How Risky is Life?
"Life is more risk management, rather than exclusion of risks." -Walter Wriston. Scholars use provided mortality data to determine how likely it is a person will die from a particular cause. They compare the data to the perception of the...
School Journalism
Investigative and Data Journalism – Day One
A free press, free to investigate and report on responsibly, compelling stories, is essential to a democracy. A 10-slide presentation details where to get ideas, how to go about an investigation, gather data, and assure the accuracy of...
Other popular searches
- Data, Census, & Statistics
- Data Analysis Pictograph
- Data Table
- Categorical Data
- Data Analysis Lesson Plans
- Data Management
- Data Analysis Graphing
- Data Analysis and Graphs
- Science Fair Project Data
- Data Display
- Organizing Data
- Census Data


