Curated OER
Credit Cards: The Good, the Bad, and the ugly
Students study how dangerous credit cards can be. They see why it is important to pay off credit card bills as soon as they can. They use MS Excel to display and understand the data. They fill out questions using the data from their...
Curated OER
Creating Tables and Bar Charts
A great way to introduce the concepts of data collection, bar charts, and data analysis. Learners see how their teacher used the data from fifty of her friends to construct a bar chart showing their favorite toys.
Curated OER
A Statistical Study of the Letters of the Alphabet
Students gather appropriate information for simple statistical analysis. Then they will calculate probability working with a piece of literature that makes this lesson ideal for teaching across the whole curriculum.
Curated OER
How Tall is the Average 6th Grader?
Upper grade and middle schoolers explore mathematics by participating in a measuring activity. They hypothesize on what the average height of a male or female 6th grader is and identify ways to find the average mathematically. Learners...
Curated OER
Why Are The Shore Birds Dying?
Learners engage in a field study of birds and how they are in danger harm due to environmental factors. They list different possible causes in a prediction activity. The observations are done while writing up data and connecting it to a...
Curated OER
How to Draw a Bar Chart Correctly
Your class has gathered their data, so what's the next step? They need to display and analyze their data, and a bar chart is a perfect tool for the job. This resource provides the step-by-step instructions those kids need to construct a...
Curated OER
Graphing It Daily
Students identify and demonstrate a positive learning attitude and use basic concepts and skills. Learners also communicate clearly in oral, artistic, written, and nonverbal form. Finally, students participate in the daily data...
Curated OER
Scatter Plot Basketball
Learners take turns shooting baskets and creating scatterplots based on the data. They create two graphs and look for possible correlation in the data for each graph.
Curated OER
Your Tax Dollars at Work
In order to understand how tax dollars are spent, young economists use given data and graph it on a circle graph. Circle graphs are highly visual and can help individuals describe data. A class discussion follows the initial activity.
Curated OER
Frequency Tables - Home Link Support
For this home school support worksheet, 2nd graders, with a home support person, review the use of frequency tables to organize and display data. They make their own frequency table and read it with the support person.
Curated OER
Frost Depth Study
Students complete activities to study the frost and frost depth. In this frost study lesson, students use frost tubes to study and measure the frost at their school. Students measure the frost in the tube and enter their data online to...
Curated OER
Mode in Statistics
Use this online math worksheet to have lerarners practice finding the mode in five different sets of data This excellent resource allows the students to check their answers, and to get "hints" should they run into difficulties. A...
Curated OER
Digital Statistics
Research data analysis by creating charts in class. Define the differences between an "average" and "range" while examining measurement data based on student height. Utilize computer software to create a height graph which is shared with...
Curated OER
Big Boats Up The River
Using boats along in the Port of Albany as the focus, learners practice adding single-digit numbers and interpreting data. This lesson comes with the worksheets, resource links, and other materials to make it a worthwhile experience.
Curated OER
Coming to Know F and C
Students collect temperatures using a probe and examine data. In this temperature lesson students complete an activity using a graphing calculator.
Curated OER
Engaging Young Scientists with Inquiry: Part Two
Evaluating data and learning to communicate the results is a big piece of the inquiry puzzle.
Curated OER
Shaquille O'Neal Hand & Foot Span
If Shaquille O'Neal wears a size-20 shoe, how big are his hands? Learners will use the average ratios of foot length to hand span to calculate the hand span of Shaq, but first, they have to collect the data! They will measure their peers...
Curated OER
Mathemafish Population
It's shark week! In this problem, young mathematically minded marine biologists need to study the fish population by analyzing data over time. The emphasis is on understanding the average rate of change of the population and drawing...
Curated OER
All Choked Up By Smoking Statistics
Scholars use the article "More College Students Are Smoking, Study Says" as a springboard for discussion on the reasons why people smoke cigarettes. They investigate different methods of graphing statistics by using the data provided in...
Curated OER
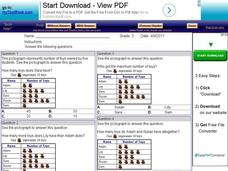
Using Pictographs With Data
For this using pictographs with data worksheet, 3rd graders read data from a pictograph to answer ten multiple choice questions. Answers can be shown on the screen.
Curated OER
Data Handling: Bus Charts
In this data display and analysis worksheet, students study a bar graph that shows the number of people who ride the bus at different times of day. Students use the graph to solve 6 problems. Note: Bus times are shown in 24 hour clock time.
Curated OER
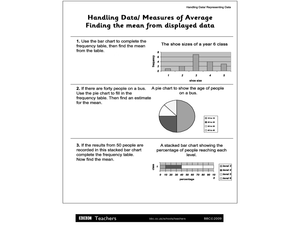
Handling Data/Measures of Average - Finding the Mean from Displayed Data
In this mean and average worksheet, students use the bars and charts to help them find the means using the given data. Students solve 3 problems.
Curated OER
Using Data Loggers
In this weather data worksheet, students use this worksheet to record data about temperature, wind speed, and more. Students complete 18 spaces on the chart.
Curated OER
Dollar Data
In this math worksheet, students examine a dollar bill in great detail. They record the facts in a data table and then give an oral report of the findings.
Other popular searches
- Data, Census, & Statistics
- Data Analysis Pictograph
- Data Table
- Categorical Data
- Data Analysis Lesson Plans
- Data Management
- Data Analysis Graphing
- Data Analysis and Graphs
- Science Fair Project Data
- Data Display
- Organizing Data
- Census Data


