Curated OER
Measurement and Paper Airplanes
Sixth graders investigate physics by creating paper airplanes. In this flight experiment lesson, 6th graders utilize stationary tools to create elaborate paper airplanes which they fly on their school grounds. Students complete...
Alabama Learning Exchange
The Mean, Median, and Mode Chain Gang
Students analyze a set of data. They work in cooperative groups and use chain links to identify the mean, median, and mode of the chain.
Curated OER
Storm Alert!
Students investigate the different types of storms by creating a graphic organizer. For this weather lesson, students analyze data from previous storms while completing a graphic organizer. Students role-play as though they are weather...
Curated OER
Calculating Baseball Statistics
Students calculate baseball statistics. In this data analysis lesson, students use baseball statistics to calculate the batting average and slugging percentage. Students visit www.funbrain.com to play a math baseball game.
Curated OER
Flight Dreams - The Pressure on Parachutes
Students investigate air pressure by researching parachutes. In this physics lesson plan, students participate in three separate experiments utilizing air pressure and paper products to test theories on parachutes. Students record the...
Curated OER
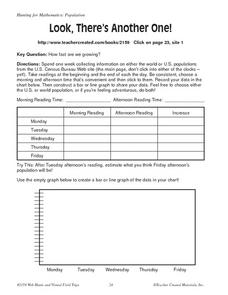
Look, There's Another One!
In this math worksheet, learners spend a week collecting information on either the word or U.S. populations from the U.S. Census Bureau Web site. Students record their data in a chart and bar graph. Learners also use the website to...
Curated OER
Canada Data Map
Students collect data and analyze it. In this algebra lesson, students collect data on the population characteristic in different regions. They use population, culture, settlement and others to help in their criteria.
Curated OER
Diagnosing Allergies Through Data Collection
Learners research and organize information about allergies. In this data collection lesson, students watch a video about allergies. Learners create a histogram using the information collected. Students complete the 'Displaying Survey...
Curated OER
Data-gathering Activities Relating to Trees in Their Environment
Students gather data relating to trees in their environment. In this biology lesson plan, students determine heights of trees and their ages. A canopy map will indicate optimal growing areas for the tree.
Curated OER
Return Intervals & Reasoning from Tabular Data
Learners calculate derivatives from a set of data. In this calculus instructional activity, students estimate the limit at infinity. They complete a Return Interval handout at the end of the instructional activity.
Curated OER
Kindergarten Class Favorites
Students discuss their favorite foods, a list of four favorite food are compiled on the board or a chart. They each vote for their favorite food and the data is entered onto a spread sheet and a graph is created while the students watch...
Curated OER
Coal Flowers
Let's make coal flowers! With this fun activity, young learners watch and learn as they grow crystals! With simple household materials and the instructions included in this lesson plan, your class can grow their own crystals. Learners...
US Environmental Protection Agency
Carbon Through the Seasons
Meteorologists view an animated video by the Environmental Protection Agency to learn how the carbon cycle works, and then move into groups to analyze and graph actual data of the atmospheric carbon dioxide concentration from Hawaii's...
Curated OER
Understanding the Bush Tax Cut Plan
The class examines the new tax cut plan proposed by President Bush. They practice calculating income tax rates and interpreting the data. Then they research topics that are of interest to them related to taxes.
Curated OER
To Recycle, or Not Recycle?
To recycle or not to recycle, that is the question. Your class can find the answer by taking a teacher created WebQuest, where they assume a role of a community member taking a stand on implementing a community wide recycling plan. The...
Curated OER
Hand Span and Height
Is there a relationship between hand span width and height? Statisticians survey each other by taking measurements of both. A table that can hold data for 24 individuals is printed onto the worksheet, along with questions for analysis....
Curated OER
Opinion Poll-arities
Students explore the mathematics behind opinion polls, as well as provides a framework for interpreting trends in opinion poll graphics.
Curated OER
Galluping Away
Pupils use Gallop Poll results to explore causes and effects of the concerns of Americans in the past. They administer a similar poll and consider what Americans in their community view as the most pressing problems in the United States...
Curated OER
What Do Maps Show?
This teaching packet is for grades five through eight, and it is organized around geographic themes: location, place, relationships, movement, and regions. There are four full lessons that are complete with posters, weblinks, and...
Curated OER
Digging Up Dino Data
Third graders use the Internet to research a specific dinosaur. They work in pairs and individually to browse dinosaur websites, take notes on pertinent information, write, edit and illustrate reports. They post their work.
Curated OER
Big Dam Construction in India
This complete and full resource includes everything needed to conduct a lesson on the environmental impact of large dams in India. Background information, handouts, answer keys, and web links are all there to help you educate your class...
Curated OER
Back-To-School Shopping
Fifth graders estimate the prices of items to be bought for back to school. They use catalogs and/or advertisements to research the cost of each of the items. They use problem solving strategies and a spreadsheet template to determine...
Curated OER
Redistricting: Drawing the Lines
Difficult redistricting concepts are covered in a context that will make it understandable to your government scholars. They begin with a KWL on the term redistricting and then watch a video to answer some questions. They analyze...
Curated OER
Observing and Recording Biological Data
Learners create their own definition of life. They identify the eight characteristics of life in organisms. They compare and contrast the characteristics of living and nonliving things.
Other popular searches
- Data, Census, & Statistics
- Data Analysis Pictograph
- Data Table
- Categorical Data
- Data Analysis Lesson Plans
- Data Management
- Data Analysis Graphing
- Data Analysis and Graphs
- Science Fair Project Data
- Data Display
- Organizing Data
- Census Data


