Curated OER
Monstrous Data
Students examine the meaning of data and data collection, represent data in various ways, and make a bar graph.
PBS
Data Plots of Exoplanet Orbital Properties
Scientists discovered the first exoplanet in 1995 and by early 2018, they confirmed the existence of more than 3,700—that's a lot of data! As part of the PBS 9-12 Space series, scholars interpret data about exoplanets. They compare...
National WWII Museum
Rationing by the Numbers: Quantitative Data as Evidence
What was it like to live on wartime rations in the United States during World War II? Young historians find out by exploring how those on the home front bought food thanks to the ration system. Other data includes statistics on car sales...
K20 LEARN
You’re The Network: Data Analysis
How do you rate? Young scholars use graphical data to analyze ratings of different television episodes. Their analyses include best-fit lines, mean, median, mode, and range.
Bonneville
Solar Panel Data Sharing
It's important to share—especially in science. Pupils share the data on voltage, current, and resistance they recorded when they built circuits with solar cells in a previous lesson plan. They discuss the results with the class and...
Curated OER
Penny Basketball: Making Sense of Data
Explore four web-based interactive sites to develop a baseline understanding of statistics. Learners play a series of penny basketball games and collect data regarding their shooting statistics. Groups decide who is the "top" penny...
Statistics Education Web
Are Female Hurricanes Deadlier than Male Hurricanes?
The battle of the sexes? Scholars first examine data on hurricane-related deaths and create graphical displays. They then use the data and displays to consider whether hurricanes with female names result in more deaths than hurricanes...
EngageNY
Summarizing Bivariate Categorical Data in a Two-Way Table
Be sure to look both ways when making a two-way table. In the lesson plan, scholars learn to create two-way tables to display bivariate data. They calculate relative frequencies to answer questions of interest in the 14th part of the...
Howard Hughes Medical Institute
Lesson 8: WildCam Gorongosa Data Analysis
How do scientists analyze data to get a specific answer to a question? The final chapter in an eight-part series of activities centered around Gorongosa National Park encourages scholars to dig deeper into the scientific process. After...
EngageNY
Using Sample Data to Estimate a Population Characteristic
How many of the pupils at your school think selling soda would be a good idea? Show learners how to develop a study to answer questions like these! The lesson explores the meaning of a population versus a sample and how to interpret the...
Curated OER
Graphs and Data
Young scholars investigate poverty using graphs. In this algebra lesson, students collect data on the effects of poverty and use different rules to analyze the data. They graph and use the trapezoid rule to interpret the data.
Curated OER
"Data Dabble"
Students engage in a lesson which facilitates their use of web sites to find data, graph it, and interpret it, thus scaffolding graphing skills to prepare students for their 8th grade I-search exit project.
Curated OER
Using Computer for Statistical Analysis
Students use the computer and S'COOL data for statistical analysis.
Curated OER
Sweet Data
Students input data about the colors of their serving of M&M candies onto a spreadsheet. They create charts and graphs based on this information.
Curated OER
Interpreting Graphs and Analyzing Data
Students investigate graphs and analyze the data displayed in the graph. They read a graph reflecting the birthday data for the students to read and analyze. Students use the graph to determine the number of birthday cards they need to...
National Wildlife Federation
Get Your Techno On
Desert regions are hotter for multiple reasons; the lack of vegetation causes the sun's heat to go straight into the surface and the lack of moisture means none of the heat is being transferred into evaporation. This concept, and other...
Curated OER
Deep Convective Clouds
Students observe clouds. In this deep convective clouds instructional activity, students analyze cloud data recorded over one month and draw conclusions based on results. Students predict "Thunderstorm Season" and prepare to defend...
Curated OER
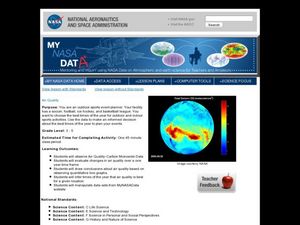
Air Quality
Young scholars observe air quality and monoxide data. In this air quality lesson plan, students draw conclusions and manipulate data from a one year period on changes in air quality.
Council for Economic Education
GDP Data: Is the Economy Healthy?
Does the economy needs a check-up? Scholars analyze the gross domestic product (GDP) to determine the overall health of the current economy. They use a short video clip as well as economic data to determine the current growth of the...
Georgia Department of Education
Math Class
Young analysts use real (provided) data from a class's test scores to practice using statistical tools. Not only do learners calculate measures of center and spread (including mean, median, deviation, and IQ range), but...
Code.org
Identifying People with Data
How much information about you is out there? Scholars explore this question as they investigate data breaches and how these violations occur. They then take part in an activity where they research how easily people could get access to...
EngageNY
Using a Curve to Model a Data Distribution
Show scholars the importance of recognizing a normal curve within a set of data. Learners analyze normal curves and calculate mean and standard deviation.
Code.org
Rapid Research – Data Innovations
Scholars conduct research into a computing innovation of their choice and figure out how it uses data. They prepare brief reports of their research in the second installment of the series.
EngageNY
Analyzing Data Collected on Two Variables
Assign an interactive poster activity to assess your class's knowledge and skill concerning data analysis. The teacher reference provides solid questions to ask individuals or groups as they complete their posters.
Other popular searches
- Data, Census, & Statistics
- Data Analysis Pictograph
- Data Table
- Categorical Data
- Data Analysis Lesson Plans
- Data Management
- Data Analysis Graphing
- Data Analysis and Graphs
- Science Fair Project Data
- Data Display
- Organizing Data
- Census Data


