Willow Tree
Box-and-Whisker Plots
Whiskers are not just for cats! Pupils create box-and-whisker plots from given data sets. They analyze the data using the graphs as their guide.
Statistics Education Web
NFL Quarterback Salaries
Use statistics to decide if NFL quarterbacks earn their salaries! Learners study correlation coefficients after using technology to calculate regression equations. Through the data, they learn the meaning of correlation and correlation...
Council for Economic Education
FRED and the Federal Budget Interactive Lesson
How can a federal debt accumulate over time? The Federal Reserve Economic Data (FRED) dashboard allows scholars to actively research each aspect of the federal budget. In pairs, they analyze economic data to determine the best way to...
Curated OER
The Scientific Method, Blood Typing, and Antibiotic Resistance
Students are given some components of an experiment, where they are able to identify and fill in missing parts, such as hypothesis, conclusion, results, etc. They form a hypothesis given general scientific facts. Students apply the...
Wordpress
Introduction to Exponential Functions
This lesson begins with a review of linear functions and segues nicely over its fifteen examples and problems into a deep study of exponential functions. Linear and exponential growth are compared in an investment task. Data tables are...
Curated OER
Weather "Whys"
Students explore the weather. In this weather data instructional activity, students collect weather data from Internet and media sources. Students graph the collected data discuss it as well as the seasons of the year.
California Academy of Science
The Heat is On: Cause and Effect and Climate
The higher the number of letters in the final word for the National Spelling Bee, the higher the number of people killed by venomous spiders. Obviously, those two facts correlate, but no causation exists. Scholars view data based on...
World History Digital Education Foundation, Inc.
COVID-19: Globalization and Economic Impact
How does COVID-19 affect a global economy? The final installment in a three-part series explores the economic impact of the illness on a global scale. High school historians discuss globalization and analyze sources of data to understand...
Curated OER
Beans and Baleen
Predict whale populations using different beans as whales! Learners observe different types of beans in a dish knowing that each bean represents a different kind of whale. They then predict how many "whales" there are in a certain area....
Curated OER
Unexpected Answers
Students explore the concept of fairness. In this fairness lesson, students play four probability games. Students determine who has the best chance of winning each of the four games. Students discuss which games gave an unfair advantage.
Curated OER
Transformations and Matrices
There are four activities in this extensive lesson covering the identity matrix and scaling, the linear representation of translations, the linear representation of rotations, and reflections. In small groups, they use the Cabri II...
Curated OER
Operation Spaghetti
Find the math in recipes. Young chefs will follow a recipe and investigate the total cost for materials. They measure amounts of food necessary for the recipe and compute the per person cost.
Curated OER
Exploring Careers
The world is full of possibilities for your ELLs. Help them explore their career options with a instructional activity that incorporates Internet research and expository writing. Not only will they learn more about their careers of...
Virginia Department of Education
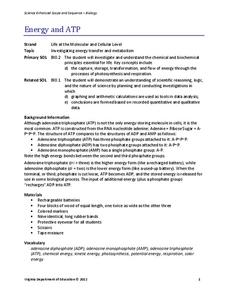
Energy and ATP
Take charge of your biology class by using this exciting analogy to relate the ATP process with batteries. Pupils use batteries and rubber bands to simulate the phosphate bonds between molecules in the body. They measure the distance in...
EngageNY
Interpreting the Graph of a Function
Groups sort through NASA data provided in a graphic to create a graph using uniform units and intervals. Individuals then make connections to the increasing, decreasing, and constant intervals of the graph and relate these connections...
Carolina K-12
The Results are In! Examining Our First Vote Election
The 2016 election is over, and now it's time to dig in to some data! An activity revolves around data gathered from the First Vote Project in North Carolina wherein thousands of students voted. After diving in to the data using provided...
Carolina K-12
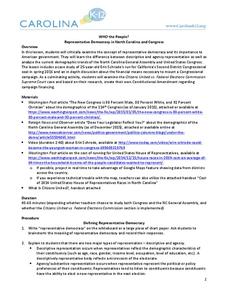
Who the People? Representative Democracy in North Carolina and Congress
Our elected officials are supposed to represent us, but what does it mean when they aren't like us? Budding citizens explore the demographic makeup of the US Congress, the role of money in political elections, and the Citizens United...
Polar Trec
Permafrost Thaw Depth and Ground Cover
The thaw depth of tundra creates a positive feedback loop with both global warming and the carbon cycle. Scholars sort photos and develop a hypothesis for ground cover and permafrost depth. Then they review the data and measurements...
NASA
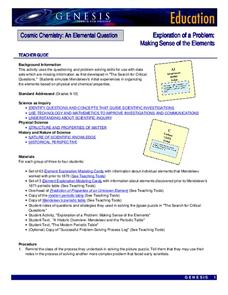
Exploration of a Problem: Making Sense of the Elements
When given too much data to simply memorize, it helps to sort it into manageable groups. The second lesson in the six-part series of Cosmic Chemistry challenges groups of pupils to take a large amount of data and figure out how to best...
Pace University
Grades 7-8 Mean, Median, and Mode
Take a central look at data. The differentiated lesson provides activities for pupils to calculate central tendencies. Scholars begin choosing three central tendency activities from a Tic-Tac-Toe board. Learners then choose from sports,...
PBS
Curious George: Graphing
After watching an engaging video where Curious George gets to play librarian for the day, sorting books, scholars sort information and graph their data. Learners move from concrete to picture to abstract graphing and analyze class...
Bowland
Crash Test
Use mathematics and simulations to investigate car crashes. IScholars test hypotheses involving car crashes. They collect, analyze, and display data from computer simulations to support or refute their hypotheses.
American Statistical Association
Confidence in Salaries in Petroleum Engineering
Just how confident can we be with statistics calculated from a sample? Learners take this into account as they look at data from a sample of petroleum engineer salaries. They analyze the effect sample size has on a margin of error and...
Nuffield Foundation
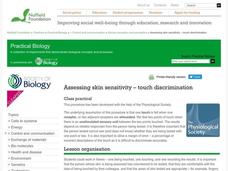
Assessing Skin Sensitivity—Touch Discrimination
How do we distinguish between the number of things touching our skin? Scholars explore an interesting lesson through an experiment. They learn that there must be an unstimulated sensory unit between two touches to distinguish them. They...
Other popular searches
- Data, Census, & Statistics
- Data Analysis Pictograph
- Data Table
- Categorical Data
- Data Analysis Lesson Plans
- Data Management
- Data Analysis Graphing
- Data Analysis and Graphs
- Science Fair Project Data
- Data Display
- Organizing Data
- Census Data


