Curated OER
Experiment Report
In this experimental design instructional activity, students fill out their title, hypothesis, independent and dependent variables, data table, graph and conclusion for their lab.
Curated OER
Canada at a Glance
Stjudents examine the statistics in a Canadian publication for use in graphs. They develop their own questions based on tables and graphs found in this publication..
Curated OER
Probability
Here is a classic activity used to introduce your class to the concept of probability and data collection. They will roll one die 30 times, then record and discuss the results. Great introduction, but too shallow to be considered a...
Curated OER
Hemlock Trees and the Pesky Pest, The Woolly Adelgid
Pupils review Excel and how to create graphs with this program. They create two graphs in Excel, one showing the average number of woolly adelgid egg sacks on the outer 15 cm of hemlock branch at sites sorted by latitude, then one sorted...
Curated OER
Long Distance Phone Plans
In this long distance phone plane worksheet, students compare various phone plans and determine which long distance plan has the greatest savings. Students support their answers visually through the use of tables and graphs. They write...
Curated OER
Bycatch
Bycatch is the unwanted and discarded marine life caught during commercial fishing. Young marine scientists review bycatch litigation and analyze graphs of bycatch data and answer questions about it. This raises awareness while...
Curated OER
Experiment Report (Normal Form)
Here is a handy handout to give any science class as a guide to writing lab reports. It is a blank outline that you can have aspiring scientists fill out when they experiment, or imitate as they record their experiments in a lab journal....
Teach Engineering
Complex Networks and Graphs
Show your class how engineers use graphs to understand large and complex systems. The resource provides the beginnings of graph theory by introducing the class to set theory, graphs, and degree distributions of a graph.
Curated OER
Graphing Ordered Pairs
Here is graphing worksheet which has pupils graph ordered pairs and label the axis. They graph five ordered pairs and then interpret the data in the graph.
Exploratorium
Jacques Cousteau in Seashells
Visionaries create images out of dots to demonstrate the eye-brain connection. Through this activity, they learn that the brain interprets data collected by the eye into recognizable information. Search online for "Jacques Cousteau in...
Curated OER
The Mitten
Explore the Ukraine through a reading of The Mitten. Readers will determine the sequence of events, cause and effect, make predictions, and find the main idea of the story. They also use math skills to make charts and graphs. Finally,...
Curated OER
Opinion Poll-arities
Learners explore the mathematics behind opinion polls, as well as provides a framework for interpreting trends in opinion poll graphics.
Curated OER
Back-To-School Shopping
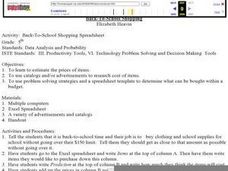
Fifth graders estimate the prices of items to be bought for back to school. They use catalogs and/or advertisements to research the cost of each of the items. They use problem solving strategies and a spreadsheet template to determine...
Curated OER
CSI Interdisciplinary Projects
Work across content areas with an engaging project that highlights higher-level thinking, teamwork, and a STEM focus.
Curated OER
What Sport Do You Like To Play the Most?== Class Bar Graph
In this math worksheet, learners participate in making a group bar graph about their favorite sports. Students are surveyed and the responses plotted on a graph.
Curated OER
Statistical Analysis for Graphing Calculators
Students use data from the Chesapeake Bay to analyze temperature, phosphate, nitrates, salinity, and oxygen levels.
National Security Agency
Starting a Restaurant
Through an engaging unit, chefs-in-training will sort and classify data using tally charts. Learners will also create bar graphs to display restaurant data and interpret data from bar graphs using a variety of categories....
Curated OER
Flicking Football Fun
Young mathematicians fold and flick their way to a deeper understanding of statistics with a fun, hands-on math unit. Over the course of four lessons, students use paper footballs to generate data as they learn how to create line...
Inside Mathematics
Snakes
Get a line on the snakes. The assessment task requires the class to determine the species of unknown snakes based upon collected data. Individuals analyze two scatter plots and determine the most likely species for five...
Virginia Department of Education
Analyzing and Interpreting Statistics
Use measures of variance to compare and analyze data sets. Pupils match histograms of data sets to their respective statistical measures. They then use calculated statistics to further analyze groups of data and use the results to make...
Radford University
A Change in the Weather
Explore the power of mathematics through this two-week statistics unit. Pupils learn about several climate-related issues and complete surveys that communicate their perceptions. They graph both univariate and bivariate data and use...
Shmoop
Box, Stem-Leaf, and Histogram
A helpful and versatile instructional activity requires young mathematicians to analyze data in order to create graphs and answer questions. Additionally, it prompts learners to find the mean, median, mode, and range of some of...
EngageNY
Analyzing Residuals (Part 1)
Just how far off is the least squares line? Using a graphing calculator, individuals or pairs create residual plots in order to determine how well a best fit line models data. Three examples walk through the calculator procedure of...
Inside Mathematics
House Prices
Mortgages, payments, and wages correlate with each other. The short assessment presents scatter plots for young mathematicians to interpret. Class members interpret the scatter plots of price versus payment and wage versus payment for...
Other popular searches
- Graphing and Analyzing Data
- Graphing and Inputting Data
- Graphing Census Data
- Graphing Using Census Data
- Graphing and Data Entry
- Graphing Weather Data
- Graphing Population Data
- Graphing and Data
- Graphing Scientific Data
- Scientific Data and Graphing
- Science Data and Graphing
- Graphing Science Data


