Curated OER
Using GLOBE Data to Study the Earth System (College Level)
Students use the GLOBE Website to locate and study environmental data. They use the GLOBE Graphing Tool to display data. Students describe the role of solar energy in the annual fluctuations of soil moisture. They describe reservoirs and...
Curated OER
Ozone and Temperature Data Analysis, South Pole Antarctica
Students discuss the layers of the atmosphere, and the history of the ozone hole. They discuss the chemistry of the ozone formation. Students compare seasonal data collected with ozonesondes. They compare Antarctic and Arctic ozone hole...
Curated OER
Interpreting Data and Statistics
Students define terms and analyze data. In this statistics lesson, students plot their data using bar and line graphs. They analyze their data after they graph it and apply the results to the Great Depression.
Curated OER
Graphing Surveys and Analyzing Data
Students analyze data and graph the results of their surveys. In this statistics lesson, students create graphs using excel to make graphs to be able to better observe their data. They conclude how great we as unique individuals.
Curated OER
Salt Front Data Set Activity
In this salt front learning exercise, students analyze data from the Hudson River and calculate highest and lowest River Mile locations as well as range of the salt front for each month on the data chart. After completing calculations,...
Curated OER
Gummy Bear Picture Graph
First graders investigate picture graphs. In this graphing instructional activity, 1st graders create a picture graph with the x-axis being number and the y-axis being color. Students sort their gummy bears by color and use pictures of...
Curated OER
The Demographics of Immigration: Using United States Census Data
Learners work together to analyze United States Census data on immigration. They compare and contrast the data and determine how immigration numbers have changed over time. They calculate percentages and make their own conclusions...
Math Mammoth
Bar Graphs 1
In this bar graph activity, students organize data in a frequency table, then create a bar graph. They find the average of the data. This one-page activity contains two multi-step problems.
Curated OER
Favorite Days of the Week
In this bar graph worksheet, students use the blank graph to survey classmates and record their favorite day of the week. Students think of one question about the graph and write it on the line.
Curated OER
Data Analysis and Measurement: Ahead, Above the Clouds
Students explore and discuss hurricanes, and examine how meteorologists, weather officers, and NASA researchers use measurement and data analysis to predict severe weather. They plot points on coordinate map, classify hurricanes...
Curated OER
Collecting Ball Bounce Data
Learners investigate quadratic equations as they use a CBR to collect and analyze data regarding a bouncing ball. Pupils explore different methods for determining the equation of the parabolic path including quadratic regression and...
Curated OER
Handling Data: measure of Average
Fifth graders analyze data from a simple table. In this graphing instructional activity, 5th graders compare distributions. Students recognize that the mean helps them find the formula. Students answer questions on the mean, median,...
Curated OER
First Class First? Using Data to Explore the Tragedy of the Titanic
Students analyze and interpret data related to the crew and passengers of the Titanic. They research information on a Titanic database to illustrate specific statistical conclusions, and whether or not social status affected the outcome.
Curated OER
School Lighting Audit Data Analysis
Students analyze the data collected in the school lighting audit. They work together to write recommendations for more efficient lighting for their school. They practice using new vocabulary and working together with others.
Curated OER
Grade 3 Mixed Math Practice- Mars, X
For this grade 3 mixed math worksheet, 3rd graders complete 9 problems. They work with fractions, nets, line segments, elapsed time, and a data table. They draw the bar graph to go with the data, and practice mental multiplication.
Curated OER
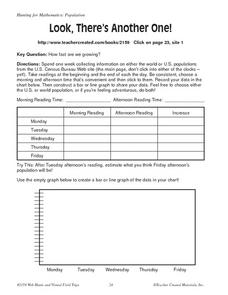
Look, There's Another One!
In this math worksheet, learners spend a week collecting information on either the word or U.S. populations from the U.S. Census Bureau Web site. Students record their data in a chart and bar graph. Learners also use the website to...
Curated OER
Make a Line Graph
In this make a line graph learning exercise, 6th graders make a line graph for 2 sets of data, using a blank grid, by plotting the numbers, labeling the x and y axes and writing a title.
Curated OER
Diagnosing Allergies Through Data Collection
Students research and organize information about allergies. In this data collection lesson, students watch a video about allergies. Students create a histogram using the information collected. Students complete the 'Displaying Survey...
Curated OER
Chance and Data
In this graphing a survey worksheet, learners poll 10 friends to see which of 2 football teams is their favorite and then graph their data results.
Curated OER
Data and charts
In this data and charts instructional activity, students answer multiple choice questions referring to different charts about mountain heights, breakfast drinks, and more. Students complete 10 multiple choice questions.
Mabry MS Blog
Scatter Plots
Scatter plots are a fun way to gather and collect relevant data. The presentation goes through several examples and then describes the different types of correlation.
Curated OER
Graphs and Transformations of Functions
Is it possible to solve quadratic equations by factoring? It is, and your class will graph quadratic equation and functions too. They perform transformation on their graphs showing increasing and decreasing intervals, domain, and range....
Curated OER
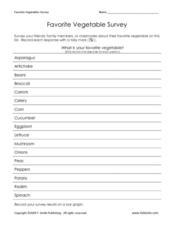
Favorite Vegetable Survey
What's your favorite? Use this chart template in your lesson on data collection and graphing. Learners record classmates' favorite vegetable in a survey, and then graph the results. A labelled graph is provided here- print both pages...
Curated OER
Usage and Interpretation of Graphs
Cooperative groups are formed for this graphing activity. Each group must construct a graph that represents how many eyelets (the holes for laces in shoes), are present in their group. A whole-class bar graph is eventually constructed...
Other popular searches
- Graphing and Analyzing Data
- Graphing and Inputting Data
- Graphing Census Data
- Graphing Using Census Data
- Graphing and Data Entry
- Graphing Weather Data
- Graphing Population Data
- Graphing and Data
- Graphing Scientific Data
- Scientific Data and Graphing
- Science Data and Graphing
- Graphing Science Data


