Curated OER
Educating European Immigrant Children Before World War I
Discover the challenges in educating immigrant children at the turn of the 20th century. Reforms that New York City schools used are described here and data is included for your class to analyze, in its evaluation of the effectiveness of...
Curated OER
Standard Units of Measure
Learners explore linear measurement. They choose appropriate measuring tools, measure three classroom items, and record their results. A class discussion ensues in which everyone decides the best way to present their data.
Curated OER
Roll `Em!
First graders engage in using base ten blocks and dice for a fun engaging math lesson. They use a worksheet imbedded in this lesson as the game board to help them play this math game.
Curated OER
Developing the Concept: Rates
Learners discover how to use the knowledge of unit rates to understand equivalent ratios and solve real-world problems. They are given word problems to solve using equivalent ratios. Tables are also covered in this resource.
Curated OER
Dynamic Data Range, Mode, and Median
Students practice statistics skills by calculating range, mode, and median. In this 4th - 6th grade lesson plan, students calculate range, median, and mode of given numbers while playing a game.
Curated OER
How Safe Is Your Backyard?
Seventh graders investigate the safety of soil and water locally and communicate via the Internet with students in different locales sharing information. They research the Internet using its multimedia capabilities and collate the data...
Curated OER
Billions of Bubbles
Students conduct an experiment with bubbles. In this observation and comparison lesson, students read Bubbles, Bubbles, Everywhere and conduct an experiment where they test different kinds of liquids to see which is the best for a...
Curated OER
Take Another Look
Seventh graders analyze different types of graphs and answer questions related to each. In this math lesson, 7th graders organize a given diagram to make it easier to interpret. They discuss why they made such changes.
Willow Tree
Linear Relationships
There's just something special about lines in algebra. Introduce your classes to linear equations by analyzing the linear relationship. Young mathematicians use input/output pairs to determine the slope and the slope-intercept formula to...
Curated OER
Vitamin D and Me
Students create a graphic organizer showing the importance of Vitamin D intake. In this Vitamin D lesson, Students list problems with Vitamin D deficiency and create poster boards in small groups. Individually, students will create menus...
Curated OER
Traditional Writing vs. Collaborative Writing
Students examine language arts by completing a group activity. In this writing styles lesson, students define and discuss the differences between collaborative writing and traditional writing while answering questions in a Smart Board...
Curated OER
Analyzing Health
Third graders analyze their health. In this analysis lesson plan, 3rd graders rate their health on a 1-10 scale. They then tally the scores from the class and create a data chart. Then they answer true and false questions based on...
Curated OER
What Can Scatterplots Tell Us?
Eighth graders use data from surveys conducted with parents, peers and themselves to create computer-generated scatterplots. They make inferences from their scatterplots.
Curated OER
The Great Turkey Walk
Students formulate questions that can be addressed with data and collect, organize, and display relevant data to answer them. They wcreate bar graphs and pie graphs
Curated OER
Collecting Data and Graphing
Eighth graders, in groups, count the different colors of M&M's in each kind of package and then draw a pictograph to show the results. Each group writes a program to show their results and then compare the manually-drawn and computer...
Curated OER
Mapping Seamounts in the Gulf of Alaska
Pupils describe major topographic features on the Patton Seamount, and interpret two-dimensional topographic data. They create three-dimensional models of landforms from two-dimensional topographic data.
Curated OER
"YIKES! Your Body Up Close" by Mike Janulewicz
Students use a Venn Diagram to analyze data from their class.
Foundation for Water & Energy Education
How is Flowing Water an Energy Source? Activity A
Here is a fun little exploration of the potential energy potential of falling water. Learners drop water from various heights using a straw, and they analyze the diameter of the splash. Pair this with two more activities of the same...
Curated OER
Bar Graphs
Students perform operations and graph their data using charts and bar graphs. In this algebra lesson, students follow specific steps to make a bar graph. They create a survey about people favorite things and plot their data from the...
Curated OER
What's Up With the Weather?
Students examine raw data about temperatures throughout the world and record their observations. They work together to graph a specific year of data. They calculate an average temperature and discuss their findings.
Curated OER
Graphs
Students explore graphs and define the different ways they are used to display data. In this algebra lesson, students collect data and plot their data using the correct graph. They draw conclusions from their graphs based on their data.
Curated OER
Venn Diagram and UK Basketball
Students analyze data and make inferences. In this algebra lesson, students collect and analyze data as they apply it to the real world.
Curated OER
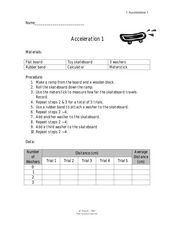
Acceleration 1
In this acceleration worksheet, young scholars use weights to increase the mass affecting the force on moving objects. Students plot a graph of their data and answer 3 questions about how the acceleration of the toy skateboard used in...
Curated OER
Weather
Students communicate how weather affects people, classify objects according to how they are used, and observe and record weather data using symbols.


