Curated OER
Introduction to Density
Seventh graders discover the definition of density through a demonstration using ethanol and ice cubes and a class discussion using a SMART Board to illustrate formulas and calculations. Students finish the lesson by practicing...
Curated OER
Raisin Cane
Students estimate and record the number of raisins in a snack-size box. They also graph their results and note the differences (+ or -) from their estimate and actual number.
Curated OER
Technology - Chaos Theory Lab
Ninth graders gain an understanding of Chaos Theory that exists in one's everyday environment.
Curated OER
Graphing Changes in Weather
Students graph current temperature and weather conditions for three days. In this weather lesson, students go to the Weather Channel's website and look up weather for their zip code then graph the conditions and record the current...
Curated OER
Modular Arithmetic Station
Eighth graders find ways to use math everyday. In this algebra lesson, 8th graders model equation and problem solving as they multiply and divide numbers. They split up in to groups as they perform hands on operations.
Curated OER
Parts Are Parts: The English Measurement System
Third graders view and measure common body parts to find a fathom, a span, and inch. They discuss the historical information about how standard English measurements came to be and why body parts can no longer be used as a standard...
Curated OER
Language Arts: Five Senses Walk
First graders take a discovery walk around the school. They use their observations to compose a class book about their school.
Curated OER
Taking a Stand on Bullying
Middle schoolers stand up against bullying in a character-building lesson. After discussing historical figures who became advocates in times of adversity, they brainstorm ways to end bullying at their own school, and use a formal letter...
Captain Planet Foundation
Shape Shifters in the Math Garden
Combines mathematical measurement with gardening skills. Third graders hunt for worms in the garden and try to find the longest one. They also measure and weigh vegetables that they harvest from the garden, measure rainfall amounts, and...
Curated OER
Native Language Arts Seasonal Poem
Intended for native Spanish speakers, this plan provides an opportunity to create a class semantic web describing the different seasons and listen to Vivaldi's "Four Seasons." Learners will work together to revise their semantic webs,...
Curated OER
Analyzing Political Cartoons
Seventh graders identify a political cartoon and analyze a pre-Revolutionary War political cartoon. In this political cartoon lesson, 7th graders discuss cartoons and the historical beginnings of American politics using a PowerPoint...
Curated OER
What is the Immune System and How Does HIV Affect It?
Student discuss the effect of HIV on the immune system. In this human body lesson, young scholars research the immune system and how the HIV virus weakens it. They create a bulletin board showing how HIV is transmitted.
Curated OER
Variation 2
Seventh graders use previously completed graphs. They discuss what the graph tells them. They discuss height, and discuss the range of the class height. Students graph data of their height with a bar graph, and repeat with eye color.
Curated OER
Self Portrait, What Nerve!
Students conduct an experiment to determine the distance between touch receptor fields in parts of the right-hand side of the body. They enter data into the data table.
Curated OER
How Fast Is that Rocket?
Eighth graders calculate the speed of a falling object using measurements from a falling rocket. They report data from their data sheet to the teacher to record on the board or on the overhead transparency and discuss the results with...
Curated OER
Probability Using M & M's
Students develop an understanding of probability by sorting bags of M & M's by color and recording the results in percents. The data is entered onto a spreasdsheet and graphed.
Curated OER
It's Your Choice
Students compare data and determine the appropriate way to organize the data. They use physical graphs, pictographs, and symbolic graphs to display their data. In addition, they complete a Venn diagram.
Curated OER
Length of the Day & the Seasons
Students answer questions for each of the graphs and record their answers on the Student Observation Sheet. They use the data they have collected, hypothesize which graph represents which month of the year using each graph. They then...
Curated OER
Plotting Wind Speed and Altitude
Students construct, read and interpret tables, charts and graphs. They draw inferences and develop convincing arguments that are based on data analysis. They create a graph displaying altitude versus wind speed.
Curated OER
State Economy Chart
Fifth graders create a 3D Pie graph using the Chart Wizard in Excel to represent their assigned states' data. They discuss the similarities and differences between states, and form a hypothesis on the relationship between location and...
Curated OER
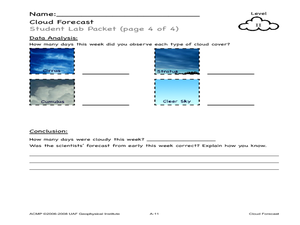
Cloud Forecast
Young scholars record weather observations and research online weather data. In this weather observations lesson, students study the cloud cover for several days and record their observations in a chart. Young scholars identify the cloud...
Curated OER
No Title
Sixth graders, after reviewing and studying the basics of recording, analyzing and presenting data, create on graph paper a bar or line graph to represent given data and then interpret the data. They answer questions about the given data...
Curated OER
Survey Say...
Students examine a variety of charts and graphs that present data in a format that is easy to read. They work in groups to conduct a survey amongst their classmates. The data collected from the survey is then put on a bar graph.
Curated OER
Hazard Alert
Students examine data regarding the occurrence of natural hazards as they occur in the United States. They record data on a classroom chart, map the areas affected by the hazards, and analyze and discuss conclusions drawn from the...


