Curated OER
On Our Way to School
First graders create a class graph that illustrates how they get to school and interpret data from the graph. They complete an assessment worksheet independently and answer questions about the graph shown.
Curated OER
Growing Up With A Mission
Student measure heights and graph them using growth charts for which they find the mean, mode, and median of the data set. They graph points on a Cartesian coordinate system.
Curated OER
Escape The Hangman
Seventh graders investigate the concept of probability. They use the game of hangman to create engagement and context for conducting the lesson. They create a spreadsheet with data that is given. Students make predictions based on data.
Curated OER
Community Voting Habits
Learners prepare a survey about voting habits in the community. Students give the survey to parents, teachers, business owners, and other voting age members of their community, and analyze the data.
Curated OER
Onwards and Upwards
Students analyze a graph representing college tuition increases, consider the possible causes and consequences of these tuition increases and collect data on tuition changes at colleges in the United States by region and graph the data.
Curated OER
Ocean Microstructure
Students assess the ocean's microstructure by analyzing graphs created during tne Ronald H.Brown research cruise. they discuss at what depths various sea animals live and write paragraphs on data analysis from the graphs.
Curated OER
Math Can Be Mean!
Fifth graders are introduced to the topic of means. Calculating the mean, mode and median, they describe what each set of numbers tell and do not tell about the data. They use a line graph to practice finding the mean. They also use...
Curated OER
Dilations of 2 and 3 dimentional figures and their effect on area, surface area, and volume.
Seventh graders investigate the area and volume of 2D and 3D figures. In this geometry lesson plan, 7th graders create a storyboard explaining their knowledge of 2D and 3D shapes. They analyze their data and interpret their results.
Curated OER
External Influences 1: Flexible Timing
Students examine the main economic objectives of the government and the impact of changing economic data on business decision making. They apply economic data to a business scenario/case study.
Curated OER
Weather Maps
Students explain the collection of weather data as presented in different formats. They use appropriate terminology related to weather maps and use the Internet to capture weather data from a city of choice and present a TV style weather...
Curated OER
Probability Plus
Students participate in a variety of activities to understand statistics. They collect and interpret data. Also students distinguish the difference between a population and a sample. They make inferences and create arguments using data.
Curated OER
Spreadsheets in Science
Fourth graders create spreadsheets, explore patterns and make predictions based on the information. They select the appropriate graph to display the spreadsheet data. They search and sort prepared data bases to gain knowledge for...
Curated OER
One Square Meter
Students examine various ecosystems using scientific inquiry. Using the local area, they assess the characteristics and conditions in one square meter. They report their findings in the form of a survey map and data sheet. They...
Curated OER
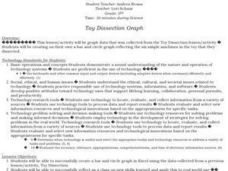
Toy Dissection Graph
Students explore simple machines and how they are made. They examine the parts of the simple machine and collect information about its parts. Using Excel, students create circle and bar graphs from the collected data.
Curated OER
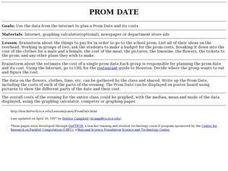
Prom Date
Students use the internet to research the cost of going to the school prom. As a class, they brainstorm about the things needed in order to go to the dance and use advertisements to make a budget. After all of the data is collected,...
Curated OER
Graphing
Seventh graders identify the different graphs used in science. For this graphing lesson, 7th graders analyze the three kinds of graphs. They construct a graph that best describes a given data.
Curated OER
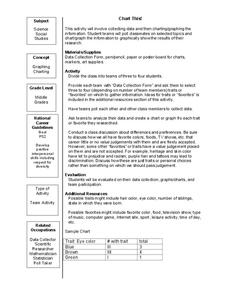
Chart This!
Students collect data and graph or chart the information. In this data organization lesson, students poll their classmates about certain topics and chart or graph the information to show the results of their research.
Curated OER
How Do We Forecast Weather?
Third graders investigate how scientists collect weather data in order to forecast the weather. They work in small groups in order to research one type of weather technology such as, satellite images, radar, surface observations, or...
Curated OER
This Old Tubeworm
High schoolers explain the process and significance of chemosynthesis. They develop their own graphic based on data of a biological community. They estimate the age of a given species as well.
Curated OER
How Are Students Doing on the AP exams?
Learners compile and analyze data pertaining to College Credit AP Exams. They pose questions - Which exam is the easiest? - determine answers from their data and display their results.
Curated OER
Bird Bulletins
Students, in groups, create a survey to investigate how much their community knows about birds. They graph their findings using a bar graph. Using the data collected, they develop an advertising campaign to increase community awareness...
Curated OER
Probability
Sixth graders explore probability. They analyze a class chart and list the letters of the alphabet according to frequency. Using the data collected, they complete probability problems.
Curated OER
On the Other Hand
Students identify traits that are either genetic or developmental in nature and determine why it might be difficult to learn if handedness is genetic or developmental. They explore theories on the causes of left-handedness by reading and...


