Curated OER
Gummy Bear Math
First graders predict, collect data, and create a graph based on gummy bear colors they are given. In this graphing lesson plan, 1st graders first predict how many colors of gummy bears there are. They then count the colors, graph them,...
Curated OER
Ranging the Triple M's
Fifth graders explore collecting and analyzing data. In this mean, median and mode lesson plan, 5th graders use real word data to determine the mean, median and mode. Students are given sets of numbers on index cards as asked to find the...
Curated OER
Birthday Graph
Students explore graphs. For this graphing math lesson, students record the birthdays of each classmate on a data table. Students cut out and add a picture of a birthday cake to a floor or wall pictograph representing the month in...
Curated OER
The Human Graph
Students produce a graph of favorite colors. In this graphing lesson, students create a human graph based on their favorite color then the teacher transfers the data to a bar graph. Students compare the lines on the graph before...
Curated OER
Chilean Sea Bass
Introduce your mini-marine biologists to using databases. Tables of how many Chilean Sea Bass were caught and number of hours spent fishing are examined. Using the data, individuals calculate the "Catch per Unit of Effort" for each year....
College Board
AP® Psychology: Teaching Statistics and Research Methodology
Psychologists use statistics? Scholars investigate the research behind the methodology of statistical analysis. Using hands-on practice, case-studies, and scatterplots, they complete various tasks to understand the very roots of high...
New York State Education Department
US History and Government Examination: January 2011
The presidencies of John F. Kennedy, Richard Nixon, and Ronald Reagan were defined by the Cold War. Using primary source documents and scaffolded analysis questions, pupils explore the effect the Cold War had on these presidencies. A...
Curated OER
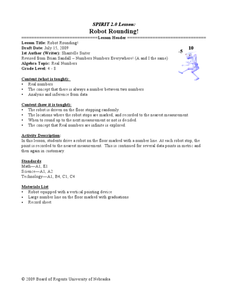
Robot Rounding!
Learners collect data on a robot and relate the behavior to prove there is an infinite minute set of numbers. In this algebra lesson, students verify that there is always a number between two numbers. They analyze and make inference from...
Discovery Education
Sonar & Echolocation
A well-designed, comprehensive, and attractive slide show supports direct instruction on how sonar and echolocation work. Contained within the slides are links to interactive websites and instructions for using apps on a mobile device to...
Curated OER
Chances Are
Upper graders examine the concept of probability. They collect data and create a bar graph. They must interpret the data as well. Everyone engages in hands-on games and activities which lead them to predict possible outcomes for a...
Curated OER
Round and Round
Learners interpret data from a three-dimensional array of current monitors to determine an overall pattern of water circulation. They hypothesize what effect an observed water circulation pattern might have on seamount fauna. A very...
Curated OER
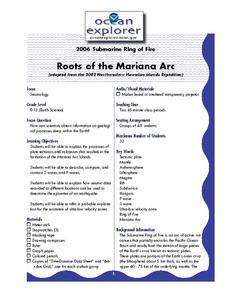
Roots of the Mariana Arc
Plumb the depths of the Submarine Ring of Fire and explore seismic waves with this lesson. Junior geologists simulate s-waves and p-waves, calculate their speeds, and then apply the data to discover the material that makes up inner...
Curated OER
Chart This!
Students collect and analyze data. For this middle school mathematics lesson, students collect data on three to four traits or favorites. Students analyze their data and create a chart of graph for each trait or favorite they researched.
Curated OER
Weather Predictions
Students record weather data and create a five day forecast. Students investigate the roles of meteorologists and identify symbols used on a weather map. After gathering weather data for a week, students will create a five day forecast...
Curated OER
Mean, Median, & Mode
Learners determine mean, median, and mode. In this problem solving lesson, students evaluate a set of data to determine the mean, median, and mode. Learners work in small groups practicing cooperative learning skills as they problem solve.
Curated OER
The Golden Students
Scholars view the video, "Donald Duck in Mathmagic Land," and discuss examples in nature which have proportions of the golden ratio. They measure and record different body lengths from a worksheet and convert the ratios to equivalent...
University of Colorado
Spacecraft Speed
Space shuttles traveled around Earth at a speed of 17,500 miles per hour, way faster than trains, planes, or automobiles travel! In the 13th installment of 22, groups graph different speeds to show how quickly spacecraft move through...
CK-12 Foundation
Understand and Create Stem-and-Leaf Plots: Event Survey
A good lesson doesn't just grow on trees! Help your classes understand the concept of a stem-and-leaf plot using an interactive lesson. Learners first create a stem-and-leaf plot from a set of data by dragging the values to the plot....
Curated OER
Converting Units Of Length
Use this converting units of length learning exercise to have your charges fill out a table, find the perimeters to three shapes and calculate the answers to three word problems.
Big Kid Science
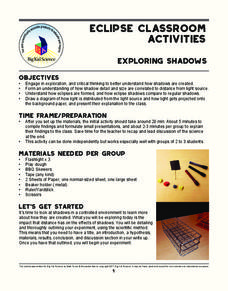
Exploring Shadows
What's that lurking in the shadows? An activity that demonstrates how eclipses happen. Science scholars investigate how light and distance interact to form shadows. The experiment uses simple materials to generate data and observations...
Centers for Disease Control and Prevention
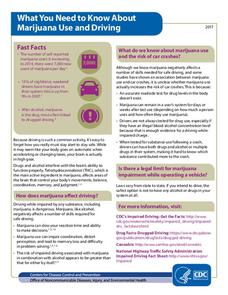
What You Need to Know about Marijuana Use and Driving
Research indicates that marijuana can negatively affect coordination and judgment, making it dangerous to drive while under the influence. But does it increase the risk of car crashes? An informative fact sheet describes the ways...
Annenberg Foundation
Evaluating Evidence
Was the Civil War fought only due to slavery? Using an interactive web tool, scholars investigate the four main causes of the Civil War. Gathering evidence and data to support their claims, they present a final statistical breakdown...
Las Cumbres Observatory
Create a Hubble Tuning Fork Diagram
Add a little color to the universe. Learners recreate images of the galaxies using real data and Photoshop software. They display their images in a Hubble tuning fork diagram by classifying and categorizing their shapes.
Las Cumbres Observatory
Star In a Box (Paper-Based)
Do stars age gracefully? Young astronomers use colored paper and data on luminosity and temperature to model the changes of a star during its lifetime. They then compare models of stars of different mass and radii.


