Curated OER
Graphing
Fifth graders practice using math graphs. In this graphing lesson, 5th graders work in groups to develop a topic of their own to represent as a graph. Students collect data and construct a graph for the lesson.
Curated OER
All About Aid
Begin this lesson by estimating the cost of a college education and comparing it to actual data. After reading an article, high school seniors discuss the processes of the college loan corporations. They listen to a lecture about how to...
Curated OER
Take Your Time
Your class examines the ways that they spend time by evaluating their own schedules. They create a peer research survey to gather information about their various habits. They analyze the data and compare/contrast the activities of...
Curated OER
A World of Information
Students analyze data and statistics about countries around the world. They read graphs and charts, color a world map to illustrate the top ten statistics about the world, and write a paragraph to summarize their information.
Curated OER
Graphically Speaking
Students discover the links between population and Congressional representation. In this government lesson, students research population statistics and create spreadsheets that compare population to the number of Congress members per state.
Curated OER
The Air Up There
In this data collection and analysis lesson, students observe and graph the weather conditions during one school week, then calculate the average weather temperature. Extensions are included.
Curated OER
Gummy Bear Picture Graph
First graders investigate picture graphs. In this graphing lesson, 1st graders create a picture graph with the x-axis being number and the y-axis being color. Students sort their gummy bears by color and use pictures of colored bears...
Curated OER
This is the Way We Go To School
Second graders create and utilize a graph using the Excel computer program. They gather data regarding how the students get to school, tally the numbers for the class, and create a bar graph on paper and using Excel.
NOAA
Importance of Deep-Sea Ecosystems – How Diverse is That?
When judging diversity of an ecosystem, both species evenness and species richness must contribute. After a discussion of diversity and a guided example using the Shannon-Weaver function, scholars use the same function on two other...
Curated OER
Create a Public Opinion Survey: The Middle East in the News
Though the discrete content here is a pair of New York Times articles about a 1998 military strike on Iraq and the coincident impeachment by the House of Representatives of then-President Clinton, this detailed plan for creating,...
College Board
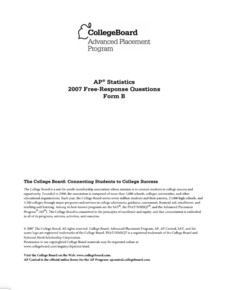
2007 AP® Statistics Free-Response Questions Form B
So that is how they do it! Pupils and teachers see how College Board assesses topics using the free-response questions from Form B of the 2007 AP® Statistics test. The six questions are divided in two sections, the first five being more...
Made by Educators
Sociological Methods
First year undergraduate sociology students can prepare for their exams with an application that provides practice questions in six categories: Quantitative and Qualitative Data, Sources of Data, Primary and Secondary Data, Positivism...
Curated OER
Home on the Range
Third graders see how to find the range of a set of numbers by analyzing data. After a lecture/demo, student pairs practice finding mode and range by solving problems put up on the board by the teacher.
Curated OER
The Guise of a Graph Gumshoe
Eighth graders practice constructing bar, circle, and box-and-whisker graphs. They practice reading and interpreting data displays and explore how different displays of data can lead to different interpretations.
Curated OER
We Are Having a Party! Part I
Second graders use data analysis skills in order to plan a class party. They graph possible times for the party noting the range for times. They discuss how mathematicians find and use the range to analyze data.
Curated OER
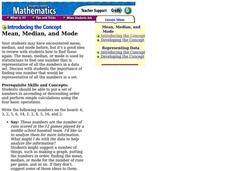
Mean, Median, and Mode
Students calculate the mean, median, and mode in a set of numbers. In this data analysis lesson, students put a set of numbers in ascending order and perform calculations to find the mean, median, and mode.
Curated OER
Weather and its Effect on the Environment and Settlement
Young scholars, after choosing two diverse cities, collect data on weather for a month and construct a graph on temperature and precipitation. After collecting population data of said cities, and graphing it, they plot population on a...
Curated OER
Heads & Tails Data Collection
For this data collection worksheet, students use a penny and a dime to play a math game. Students flip the money in the cup and then record the number of heads and tails showing marking the coins in the box.
Curated OER
Range and Measures of Central Tendency
Third graders take notes on a PowerPoint presentation featuring calculating and analyzing data. They practice skills highlighted in the presentation and create a table in Microsoft Excel showing data analysis.
Curated OER
Air Pollution: Visible And Invisible
Fourth graders observe air pollution that is visible and invisible with experimentation. During the experiment the students collect data that needs analysis. The observations are recorded in the lab journal. The data also is represented...
Curated OER
Friction and Inertia
Students study friction and inertia, make predictions, and compare data. In this investigative lesson students view a demonstration on friction, divide into groups, and complete an activity.
Curated OER
How Many Letters Are In Your Name?
Learners discover how to make a graph that represents the number of letters in their names. In this early childhood math lesson plan, students collect data, categorize data, and develop skills to analyze the pieces of data.
Curated OER
Graphing the Forecast - Line Graph or Bar Graph?
Sixth graders compare and contrast bar and line graphs. Using a weather forecast of the area, 6th graders record the high and low temperatures in a table. Students determine and justify the most appropriate graph to display a given set...
EngageNY
Describing the Center of a Distribution
So the mean is not always the best center? By working through this exploratory activity, the class comes to realize that depending upon the shape of a distribution, different centers should be chosen. Learners continue to explore the...


