Curated OER
A Class Census
Students recognize that data represents specific pieces of information about real-world activities, such as the census. In this census instructional activity, students take a class and school-wide census and construct tally charts and...
Curated OER
About the Census
Students interpret a variety of informational texts to gain understanding of basic concepts about how census data are used. In this census lesson, students read maps, complete worksheets, and work in small groups to become aware of...
Curated OER
Aboriginal Statistics
Fourth graders analyze statistics of Native Americans by creating graphs. For this data analysis lesson, 4th graders define different statistical terms and practice finding those statistics from groups of numerical information about...
Curated OER
US City Quality of Life Analysis and Comparison
Students analyze US census data and criteria to compare and measure the quality of life in the country's fifty largest cities. After accessing the 2005 quality of life world report online, students conduct their study to compare three...
Florida International University
Counting FishStix
How do we count the fish in the ocean? An engaging lesson models how to estimate fish populations with observational surveys. Class members begin by studying the behavior of fish on the coral reef in the oceans. They then become the fish...
US Department of Commerce
Over the Hill - Aging on a Normal Curve
Nobody is too old to learn something new. Young statisticians analyze census data on the percentage of the population older than 65 years old in US counties. They fit a normal distribution to the data, determine the mean and standard...
US Department of Commerce
Immigration Nation
People come and people go. Given tabular census data on the annual number of immigrants from four different regions of the world between 2000 and 2010, pupils create double bar graphs and line graphs from the data. They analyze their...
US Department of Commerce
The Place of My State
State the population of the state. Pupils research census data on the total population, the number of children their age, and the number of children of the same age and gender in their states. They write these numbers in standard,...
Bowland
Fashionista
So trendy! Show your class how to identify trends in sales patterns using mathematics. Scholars use a software simulation to collect data on age groups, price, and sales at a fashion store. This data allows individuals to determine the...
It's About Time
Factors Affecting Population Size
How do we predict future population growth? Young researchers investigate various factors affecting the size of our population. As they calculate and interpret graphs to determine factors that could potentially affect increases and...
Curated OER
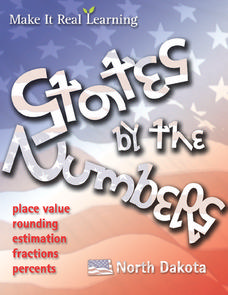
Using Real-Data from North Dakota to Study Place Value, Rounding, Estimation, Fractions, and Percents
In this real-data activity, students use data from the 2008 Census Bureau to answer eight questions divided into four activities. The topics covered include: place value, rounding, estimation, fractions, and percents.
Curated OER
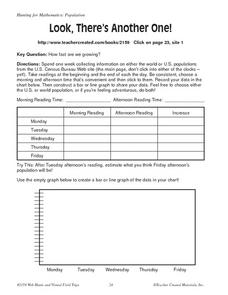
Look, There's Another One!
In this math worksheet, learners spend a week collecting information on either the word or U.S. populations from the U.S. Census Bureau Web site. Students record their data in a chart and bar graph. Learners also use the website to...
Curated OER
Student Census
Students collect data from their peers and store the information in a database. As students manage the information they realize the usefulness of a database as a tool to manage large amounts of information in an efficient and accurate...
Curated OER
Redistricting: Drawing the Lines
Difficult redistricting concepts are covered in a context that will make it understandable to your government scholars. They begin with a KWL on the term redistricting and then watch a video to answer some questions. They analyze...
Curated OER
From Data to Drinks - My Marketing Plan
Students research and discuss how Canada's aging population affects advertising. They record information from the 2001 census and create a marketing plan to sell a soft drink.
US Department of Commerce
Apportionment: Grades 3-4
Apportionment is a big word for young pupils. Use a helpful cartoon video and worksheet with data set to help them understand how the census fuels representative democracy. After examining how the census determines the number of seats a...
American Statistical Association
Bear Hugs
Scholars research arm span to determine who gives the best bear hugs. They use data from a national study to find the standard statistics for arm span. It includes mean, median, quartiles, spread, standard deviation, and more.
Curated OER
Building Data
Students collect census data to help them determine where to build a new supply superstore.
Curated OER
Data Collection
Students explore the reason for collecting and analyzing facts and figures or data and statistics. They show how data can be used to help us to solve real life problems and plan for the future. Students use everyday problems that can be...
Curated OER
It's Census Time: Census Lesson Plans
Census lesson plans can provide an interdisciplinary look at how the data is used, and what it means for everyone.
Curated OER
1930 Census and the Consitution
Students read the Constitution and discuss the importance of enumeration. In this Census instructional activity, students complete a Census schedule and discuss the job skills of applicants. Students research Census data to compare and...
Curated OER
The New York City Draft Riots: A Role Play
This is a fun, thought-provoking lesson. Learners use census data from 1855, primary source documents, their historical knowledge, and information regarding the New York City Draft Riots of 1863 to construct and engage in a role-play....
American Statistical Association
Armspans
Young mathematicians collect data on the arm spans of classmates. Then they sort the data by measures of center, spread, and standard deviation. Finally, they compare groups, such as boys and girls, to interpret any differences.
EngageNY
Modeling with Exponential Functions
These aren't models made of clay. Young mathematicians model given population data using exponential functions. They consider different models and choose the best one.
Other popular searches
- Data, Census, & Statistics
- Census Data
- Census Data Analysis
- Analyzing u.s. Census Data
- Analyzing Census Data
- Data Census & Statistics
- Graphing Census Data
- United States Census Data
- Graphing Using Census Data
- 2010 Census Data
- Census Data 1860s
- Historical Census Data Browser


