Curated OER
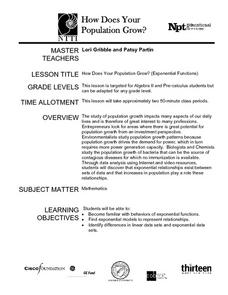
How Does Your Population Grown?
Do you know how the population has grown of your community? Can you predict the population over the next half century? Can we find an algebraic model that matches our data? These along with many more questions can be researched by...
Curated OER
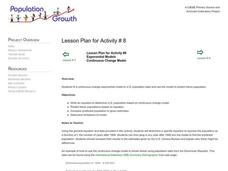
Exponential Models
Students fit a continuous change exponential model to U.S. population data and use the model to predict future population.
Curated OER
Drug Sales Soar: Bar Graph
In this graphs worksheet, students analyze a bar graph that shows retail prescription drug sales in the U.S. Students complete five problem solving questions about the data on the graph.
Curated OER
Making Sense of the Census
In this unit of lessons, students make sense of the census. They examine why a census is taken and participate in activities.
Curated OER
Making Sense of the Census
For this unit of lessons, students make sense of the census. They examine why a census is taken and partipate in activities.
Curated OER
Making Sense of the Census
In this unit of lessons, students make sense of the Census. They examine why a census is taken and participate in activities.
Curated OER
Classroom Census
Students take a classroom census. They count in sets, sortan classify groups and ascertain the value of counting.
Curated OER
Jobs in Jamestown
Students research occupations of Jamestown settlers using census data, and evaluate the data to show the needs and activities of the colony.
Curated OER
World Statistic Day
Eleventh graders collect data about the state they live in. In this statistics lesson, 11th graders collect and analyze data as they compare themselves to students in other states. They analyze data about a person's education level, and...
Curated OER
Slavery: Population Growth in Arkansas
Eighth graders examine the number of slaves in Arkansas in each census period from 1820 to 1860. They graph the data using the proper labeling and write a paragraph summarizing the data from each period making comparisons between slave...
Curated OER
Political Polls
Students explore politcical polling by conducting a poll of student body elections. They prepare a survey, distribute forms, and tabulate data.
Curated OER
Young Voters Make A Difference
Students research recent statistics on voting by those 18 to 24. They survey senior students to determine their intent to vote in the next election. Students display the data in charts and graphs. They write the results and share it with...
Curated OER
The First Nations, Métis, and Inuit Peoples of Canada
Learners explore demographic shifts. In this Canadian Census lesson, students interpret data from the 2006 Census to determine the needs of the Aboriginal population in the country.
Curated OER
Pop Clock
Pupils review the Census Bureau's Homepage, gather information regarding population trends in order to make predictions on future populations.
Curated OER
Lesson 2: Mapping Sub-districts
Students learn more about the census. In this mapping sub-districts lesson plan, students visualize census data on a map, use a map key to read a population map, and better understand the concept of population density.
Curated OER
Mapping the changes in Canada's population
High schoolers find and analyze data found in the census. They compare the population from 1996 to 2001. They explore the type of data they can find in the Census of Population.
Curated OER
Distribution of children living at home
Students examine census data to evaluate the number of students of certain ages living at home. This data is then used to determine the need for day care, or other social programs. They use this information to explore social policies.
Curated OER
Families
Students examine Canadian census data from 1981 and 2001 to investigate how the family structure has changed. They investigate important aspects of family life.
Curated OER
The Household Environment Survey
Students examine data collected from a national survey of household environmental practices to develop their own questionaires. Once they have their own survey questions, students conduct their own investigations, and report their findings.
Curated OER
Census 2000: Future focus
Students recognize the importance of the census. They identify specific concerns of different population groups. They design an advertisement for Census 2000.
Curated OER
Hi, Deer!
Students collect, organize by table, and examine census data in a simulation, estimate the size of the population in the simulation and make predictions based on the collection of census simulation data.
Curated OER
Population Pyramids
Students engage in a lesson that is about the concept of measuring the statistical data of a population taken from a census. The data is interpreted and recorded looking for trends in subjects like world economy and job opportunities.
Curated OER
Distribution of children living at home
Students use E-STAT to examine demographics. In this social demographics lesson, students use statistical data to determine if a particular family is in need of assistance. Students will discuss social and educational policies and...
Curated OER
Reshaping the Nation
Students learn why the census makes a difference. For this U.S. Census lesson plan, students learn how to read and use a cartogram while they explore new ways to represent data.
Other popular searches
- Data, Census, & Statistics
- Census Data
- Census Data Analysis
- Analyzing u.s. Census Data
- Analyzing Census Data
- Data Census & Statistics
- Graphing Census Data
- United States Census Data
- Graphing Using Census Data
- 2010 Census Data
- Census Data 1860s
- Historical Census Data Browser


