Willow Tree
Circle Graphs
Pie isn't just for eating! Scholars learn to create pie charts and circle graphs to represent data. Given raw data, learners determine the percent of the whole for each category and then figure out the degree of the circle that percent...
Curated OER
A Planting We Will Go
Even the youngest kids can make scientific comparisons using collected data. They read The Tiny Seed, then discuss the essential nutrients and elements needed for a seed to grow into a blooming plant. They plant seeds and track their...
Radford University
Regression Analysis Activity
Don't let your knowledge of regression analysis regress. Pupils take part in three activities to learn about regression curves. They research and collect data to predict how long it will take a basketball to hit the ground, find a...
Curated OER
Probability Lesson 3
Here are a few well-thought-out discussion questions intended to accompany a probability activity. Learners consider equal chance outcomes under given situations, they investigate those outcomes by tossing a coin 30 times. They analyze...
Curated OER
Stream Consciousness
Actual stream water is analyzed in this environmental science activity. Participants measure water temperature and pH, and then survey the macroinvertebrates living in their samples. The data worksheet, troubleshooting tips, and...
Concord Consortium
Heights and Weights
Height is dependent on weight—or is it the other way around? Given data from a physicians handbook, individuals compare the height and weight of males and females at different areas. They calculate differences and ratios to assist with...
Beyond Benign
Exothermic and Endothermic Reactions
How can you tell the difference between endothermic and exothermic reactions? Chemistry scholars perform and observe two chemical reactions, measure the temperature throughout, then draw conclusions about changes in energy from their...
Curated OER
Choose The Appropriate Graph
Fifth graders work in groups to investigate the proper use of a graph during a schoolyard ecology project. The challenge of the project is for students to choose the proper form of a graph. They gather data and conduct analysis with the...
Curated OER
Graphing Memories
Mem Fox’s Wilfrid Gordon McDonald Partridge provides the labels for a graphing activity. Class members create an illustration of a memory item brought from home, and place their illustration in the proper column of a graph. When the...
Curated OER
ABC Data Sheet
Ever wonder why your special-needs or autistic learners have out bursts in class? Use this ABC Data collection sheet to determine the antecedent, behavior, and consequence to help you determine a possible function for your student's...
Curated OER
Data Analysis
Twelfth graders collect and analyze data. In this secondary end-of-course mathematics lesson, 12th graders formulate a question they would like to answer and decide on an appropriate means of data collection. Students present their...
Curated OER
Ocean Exploration: How Doea you Data Grow? (Grades 7-8)
Learners explore fieldwork. In this seventh or eighth grade mathematics lesson plan, students watch a video on data collection in the field. Learners use fieldwork to gather data about their school environment. Students compile data...
Curated OER
Visual Communication of Quantative Data
Students collect and analyze data based on academic performance. In this statistics lesson, students create graphs and analyze the data they created. They use positive, negative and no correlation to analyze the data.
Curated OER
TV Survey - Data Collection and Analysis
In this data collection and analysis worksheet, 4th graders complete a tally chart about the number of hours that fourth graders watch television. They create a bar graph with the information, write a paragraph about the survey results,...
Curated OER
Data Collection and Graphing
Students collect data and graph it on a coordinate plane and analyze it. In this statistics lesson, students display their data collection using a graph. They determine which central tendency will work best.
Curated OER
Collect and Organize Data: Reteach
In this data collection worksheet, students learn the parts of a tally chart and how it organizes information. Students then use the second tally chart to help them answer the six questions.
Curated OER
Excel Turns Data Into Information
Learners use excel to analyze data. In this technology lesson, students enter data into the excel program to find averages and organize data.
Virginia Department of Education
Numbers in a Name
What's in a name? Pupils create a data set from the number of letters in the names of classmates. Each group then takes the data and creates a visual representation, such as a histogram, circle graph, stem-and-leaf plot, etc.
Statistics Education Web
Walk the Line
How confident are you? Explore the meaning of a confidence interval using class collected data. Learners analyze data and follow the steps to determine a 95 percent confidence interval. They then interpret the meaning of the confidence...
Curated OER
M & M Madness
M&M's are always a great manipulative to use when teaching math. In this graphing lesson plan, learners predict how many of each color of M & M's there are. They count up each color and plug the data into a graph using the...
Chicago Botanic Garden
Preparing for Project BudBurst
Plants take cues from the environment—change in daylight hours and temperature—to complete their seasonal life cycles. Lesson four in the series of six has classes collect phenology data on plants. After taking initial observations,...
NOAA
Graphing Temperatures
Battle of the hemispheres? In the fourth installment of a five-part series, young oceanographers use the NOAA website to collect temperature data from drifters (buoys), one in the Northern Hemisphere and one in the Southern Hemisphere....
Messenger Education
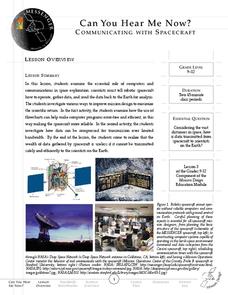
Can You Hear Me Now?—Communicating with Spacecraft
Radio signals transmitted to Pluto take five hours to reach their destination! In these two activities, young scientists explore data communication in space. In activity one, pupils learn how data is gathered and sent back to Earth....
Curated OER
Mrs. Lewis's Pets: Tally Mark Activity
To cute to pass up! This slide show activity has learners count the number of pets Mrs. Lewis has using tally marks. As the show progresses, kids pay attention and make a tally for each type of pet they see. Suggested uses and audio are...
Other popular searches
- Collecting and Recording Data
- Collecting and Organizing Data
- Collecting and Graphing Data
- Collecting and Using Data
- Games on Data Collecting
- Collecting Weather Data
- Collecting and Comparing Data
- Patterns Data Collecting
- Math Data Collecting
- Patterns, Data Collecting
- Collecting and Charting Data
- Patterns\, Data Collecting


