Curated OER
Favorite Days
Students collect and organize data about themselves. In this data analysis lesson, students discuss their favorite calendar dates and explore ways to display the data.
Curated OER
Graphing the Past Using Today's Technology
Eighth graders research statistical data regarding their current social studies unit. They write questions about the measures of central tendency, collect and analyze the data, insert the data into a spreadsheet, and generate graphs.
Curated OER
Probability
Second graders experiment with probability. In this probability lesson plan, 2nd graders pick colored beans from a bag to find the chance of getting different colors. They make fair and unfair spinners and record the data after spinning...
Curated OER
Watch the Sky: Observing Clouds and Patterns
Students observe clouds outside of the classroom. In this weather activity, students investigate and record the clouds above their classroom everyday for three weeks. The students then analyze their data and discuss what causes specific...
Curated OER
Creating a Spreadsheet and Graph
Young scholars create graphs in Excel. In this spreadsheet instructional activity, students input data into spreadsheet cells then use the graphing feature of the Excel program to produce colorful graphs of the data. The directions to...
Curated OER
What Influences Reaction Rate?
Learners study reaction rates, what determines how fast a reaction happens and how the chemical changes occur. In this reactions lesson students complete a lab where they use Alka-Seltzer to observe reaction rate and create a graph with...
Curated OER
Energy Efficient Homes
Students observe and gather data from a model simulated home. In this efficiency lesson students examine the factors that influence energy efficiency, complete a lab activity then draw conclusions from their data.
Curated OER
Animal Skin
Students investigate the skin surface to body area ratios for different animals. In this seventh/eighth grade mathematics/science lesson, students explore heat transfer between an animal’s body and the environment. Using technology,...
University of Georgia
Using Freezing-Point Depression to Find Molecular Weight
Explore the mathematical relationship between a solvent and solute. Learners use technology to measure the cooling patterns of a solvent with varying concentrations of solute. Through an analysis of the data, pupils realize that the rate...
American Statistical Association
Bubble Trouble!
Which fluids make the best bubbles? Pupils experiment with multiple fluids to determine which allows for the largest bubbles before popping. They gather data, analyze it in multiple ways, and answer analysis questions proving they...
Teach Engineering
Linear Regression of BMD Scanners
Objects may be more linear than they appear. Scholars investigate the relationship between the number of bone mineral density scanners in the US and time. Once they take the natural logarithm of the number of scanners, a linear...
Curated OER
Rescue Mission Game
Students conduct probability experiments. For this rescue mission lesson plan, sudents play a game and collect statistical data. They organize and interpret the data and determine the probability of success. Students plot points on a...
Teach Engineering
Using Hooke's Law to Understand Materials
Provide a Hooke for a lesson on elasticity with an activity that has groups investigate a set of springs. They use a set procedure to collect data to calculate the spring constant for each spring using Hooke's Law. The groups predict the...
Rice University
Introductory Statistics
Statistically speaking, the content covers several grades. Featuring all of the statistics typically covered in a college-level Statistics course, the expansive content spans from sixth grade on up to high school. Material comes from a...
Cornell University
Density
Certain things just do not mix, including liquids of varying densities. Learners collect data to determine the densities of several liquids. They then use the density information to predict the type of liquid.
Curated OER
Survey Says...
Young statisticians collect, organize, and present data to illustrate responses to a survey question. They write and conduct the survey. They finish by presenting the results in the form of a graph.
Teach Engineering
Spring Away!
The last segment of the nine-part unit makes a connection between springs and linear equations. Groups hang weights from the spring and measure its length. Then, using the data collected, they calculate the slope to find the k-value of...
It's About Time
Present-Day Climate in Your Community
So what exactly is climate? This first installment of a six-part series introduces the concept of climate using real-world data tables and topographic maps. The timely lesson includes a comprehensive overview of climate, as well as...
University of California
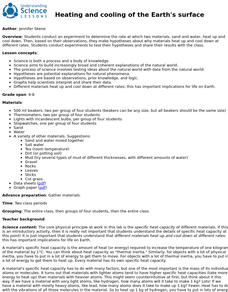
Heating and Cooling of the Earth's Surface
Scholars collect data from heating sand and water before forming testable hypotheses about why sand heats up faster. Afterward, they develop and run experiments to test their hypotheses.
Curated OER
The Solstices
Compare surface temperatures when the solstice occurs in the different hemispheres. Young scientists draw conclusions from their investigation of data collected using spreadsheets and a globe.
Curated OER
Analytical Problem Solving
Students explore about propagation of error in calculations using experimental data. They develop their weighing and pipetting techniques. Students explore the following terms: Standard deviation and relative standard deviatin. They...
College Board
2015 AP® Statistics Free-Response Questions
Statistics is all about making inferences. Can you infer how your pupils will fair on their AP® exams? Collect your own data by giving them practice tests such as the 2015 free-response exam. The six-question test includes topics such as...
Curated OER
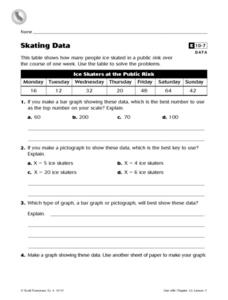
Skating Data
In this collecting data worksheet, 4th graders view a table on ice skaters at a public rink in order to answer 2 multiple choice questions, 1 short answer question and make a graph showing one piece of the data.
Curated OER
Data Analysis and Probability
Students make their own puzzle grid that illustrates the number of sit-ups students in a gym class did in one minute, then they make a histogram for this same data. Then they title their graph and label the scales and axes and graph the...
Other popular searches
- Collecting and Recording Data
- Collecting and Organizing Data
- Collecting and Graphing Data
- Collecting and Using Data
- Games on Data Collecting
- Collecting Weather Data
- Collecting and Comparing Data
- Patterns Data Collecting
- Math Data Collecting
- Patterns, Data Collecting
- Collecting and Charting Data
- Patterns\, Data Collecting


