Curated OER
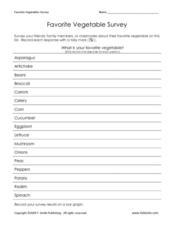
Favorite Vegetable Survey
What's your favorite? Use this chart template in your lesson on data collection and graphing. Learners record classmates' favorite vegetable in a survey, and then graph the results. A labelled graph is provided here- print both pages...
Curated OER
How Many Fish in the Pond?
How many fish are in Mills Pond? Learners examine an image with 17 fish. There are four types of fish, each of which is displayed on a data chart. Focus on collecting data and counting as scholars record the number of each type in its...
Curated OER
Famous Authors Biographical Data Form
Who wrote To Kill a Mockingbird? What about Wuthering Heights? Prodigal Summer? Encourage learners to study the authors of their beloved books. This form will help them organize information as they learn about different authors. After...
Curated OER
How Much Do I Watch TV?
For this television watching worksheet, students determine the amount of television they watch in a week by recording the names and times of the shows. They total the number of hours of watching time. You can use this with upper...
Curated OER
Data Analysis
Students double check their data collections of Top 20 singles that they've been collecting for several days. Types of data is reviewed in detail and a variety of questions are asked for retention factors of mastery. They draw a tally...
Curated OER
Independent Investigation
In this science worksheet, students write what they want to discover and identify what they feel will happen. Then they design an experiment and write the steps for it in the space provided. Students also create a data table or chart...
Curated OER
Oil and Energy Consumption
Young scholars analyze the oil consumption and production information. In this investigative lesson students take the data collected, graph and organize it then draw conclusions about the use of oil worldwide.
Curated OER
Spaghetti Graphs
Learners work in pairs to test the strength of spaghetti strands. They collect and graph data to determine a line of best fit. Students create a linear equation to interpret their data. Based on the data collected, learners predict...
Curated OER
Cricket Weather
In this collecting data worksheet, 4th graders use the data collected on crickets chirps and the temperature to make a line graph by following 4 directives.
Curated OER
Lesson 1: Map Data and the Census
Students learn about the history of the census. In this U. S. Census lesson plan, students develop an understanding about how the United States Constitution grants and distributes power and discover how the spatial organization of...
Curated OER
Teacher's Plant Collection Guide
Young scholars explore a variety of guidelines that involve collecting plants in a responsible manner and participate in a plant pressing activity. In this teacher's plant collection guide lesson, students collect data regarding plants,...
Curated OER
Graphing Predator/Prey Data
Learners use data from the Camouflage Game (played with red and green yarn caterpillars) to create a composite bar graph to display the collected data. They interpret the data and form a conclusion based on the graphs. Teachers may use...
Curated OER
Quantitative Data
In this algebra instructional activity, students collect data using tally marks. They then record their data, graph it and analyze it. There are 23 questions with an answer key.
Omaha Zoo
Monitoring Amphibians
What sort of shoes do frogs wear? Open toad sandals. If your scholars want experience collecting field samples, this is the lesson for you. After learning the proper way to collect field samples, pupils catch amphibians to test for...
Curated OER
Dice Games
Games and activities are wonderful for igniting interest in nearly any topic. With a pair of dice, your class will practice their basic math and social skills at the same time. Learners battle it out to see who can roll only odds or only...
Curated OER
Sorting Plastics For Recycling
First, young chemists practice polymer identification by density and flame tests. With the data collected, they propose a method of separating polyethylene from other plastics and determine what property makes it desirable for recycling....
Curated OER
Pen Pals
Students collect bird count data at their sites, and share and compare the data collected from two different schoolyards using computer technology.
Radford University
Sleep and Teen Obesity: Is there a Correlation?
Does the number of calories you eat affect the total time you sleep? Young mathematicians tackle this question by collecting their own data and making comparisons between others in the class through building scatter plots and regression...
Curated OER
Linear Regression and Correlation
Learners explore scatter plots. For this linear regression lesson, groups of pupils graph scatter plots and then find the line of best fit. They identify outliers and explain the correlation. Each group summarizes and shares their...
US Environmental Protection Agency
Weather and Climate: What's the Difference?
Future weather forecasters collect daily temperatures over a period of time. Afterward, they compare their data with monthly averages, as researched on national weather websites, in order to grasp the difference between weather and...
American Statistical Association
Armspans
Young mathematicians collect data on the arm spans of classmates. Then they sort the data by measures of center, spread, and standard deviation. Finally, they compare groups, such as boys and girls, to interpret any differences.
NOAA
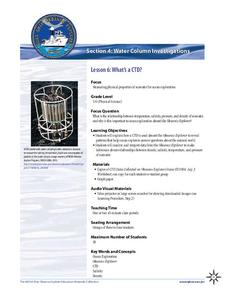
What's a CTD?
Why are the properties of the water important when exploring the ocean? Young scientists discover the tools and technology used in deep sea exploration in the fourth installment in a five-part series. Groups work together to examine...
Curated OER
Interpreting Your Data
In this water quality sampling learning exercise, students organize and analyze their data from samples they have collected. After analyzing based on 9 guide questions, they complete 18 short answer questions about fish, benthic, and...
Curated OER
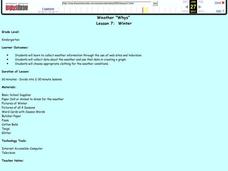
Weather "Whys"
Students explore the weather. In this weather data lesson, students collect weather data from Internet and media sources. Students graph the collected data discuss it as well as the seasons of the year.
Other popular searches
- Collecting and Recording Data
- Collecting and Organizing Data
- Collecting and Graphing Data
- Collecting and Using Data
- Games on Data Collecting
- Collecting Weather Data
- Collecting and Comparing Data
- Patterns Data Collecting
- Math Data Collecting
- Patterns, Data Collecting
- Collecting and Charting Data
- Patterns\, Data Collecting


