Curated OER
Statistical Analysis of Data by Gender
Students examine and identify gender bias, stereotyping, and discrimination in school materials, activities, and classroom instruction. They apply descriptive statistics knowledge to real-world data.
Curated OER
Making a Bar Graph
In this bar graph worksheet, students analyze a data table and bar graph depicting information about stickers collected. Students answer 5 questions about the data displayed.
Curated OER
Locating Vent Fields Using CTD Data
Students describe the way hydrothermal vents work. Students work on locating vent regions through remote collection of data about water temperature and density. Comparing density and temperatures graphs, students search for indicators...
Curated OER
Diffusion & Osmosis with Data Analysis
Pupils explore principles governing diffusion and osmosis. Students perform a dialysis tubing experiment. They obtain core samples of potato in varying concentrations of sugar-water to measure water potential of the potato cells. Data...
Curated OER
Model Data with Quadratic Functions
Students model data using quadratic equations. In this algebra lesson, students simplify and factor quadratic equations. They graph the function using collected data and analyze the parabola.
Curated OER
Using Radiosonde Data From a Weather Balloon Launch
Student use radiosonde data from a weather balloon launch to distinguish the characteristics of the lower atmosphere. They learn the layers of the atmosphere. They graph real atmospheric data.
Curated OER
Cloud Types
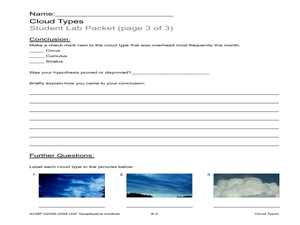
Students examine cloud types. In this cloud lesson, students identify cloud types, observe clouds and collect data, and analyze data to identify the most common cloud they observe overhead during the course of a month.
Curated OER
Logarithmic Transformations of Data
Students investigate and study logarithmic equations. In this precalculus lesson, students analyze the data behind the function. They define each graph as positive, negative or no correlation. They find the line of best fit.
Curated OER
Halloween Graph Paper
For this Halloween graphing worksheet, 5th graders enhance their math skills by using the graph to help them collect and organize data.
Curated OER
Collecting Data
Fifth graders collect and describe data. Through various inquires, they collect information and describe it in graph form. Students predict information, find the actual amount based on their data and compare their findings with their...
Curated OER
Graphing Pockets
Second graders explore graphing. They count the number of pockets on their clothes and use Microsoft Excel to enter their data. Students create a class graph displaying their findings.
Curated OER
The Guise of a Graph Gumshoe
Eighth graders practice constructing bar, circle, and box-and-whisker graphs. They practice reading and interpreting data displays and explore how different displays of data can lead to different interpretations.
Curated OER
Sunspot Graphing
Students, using 15 years of sunspot data, plot data on a classroom graph. They discuss why the pattern from their individual sheets did not and could not match the class graph.
Curated OER
Graphing Fun
First graders analyze objects and make a graphing picture to analyze the data. In this graphing lesson, 1st graders complete an object graph assessment, a picture graph assessment, and a bar graph assessment to analyze their given objects.
Curated OER
Chart/Graph
Students create a class survey, place the data in a spreadsheet and graph the information.
Curated OER
Excel Lesson
Fifth graders will perform exercises and write the number of each exercise performed on the collection data sheet. They survey eight of their classmates for their exercise data and write that data on the collection data sheet. They then...
Curated OER
Endangered Species
Ninth graders graph data in order to compare the number of extinct species and a rise in human population. They analyze the data collected. Students are encouraged to infer the relationship.
Curated OER
Vectors: Follow That Arrow
Vectors and their connection to motion. A video will be presented to provide information for the class to use methods of solving vectors with and without grids. Real-world physical concepts will be explored in reference to vectors.
Curated OER
Apple Graphing
Do you like apples? Create a taste test for your first and second grade learners. Cut red, green, and yellow apples, and have learners select their favorite. After tasting all of the apples, they collect data and graph the results with...
Curated OER
Weather Pals
Young scholars study maps of the United States to locate weather pals from a list of schools. They communicate with Weather Pal schools through the use of closed circuit TV. Using weather data collected in their area, they exchange the...
Curated OER
Data Days
Sixth graders practice collecting, organizing and displaying data. They create circle, bar, line and picto graphs. They analyze data in small and large sample groups.
Curated OER
Rouge River Data
Students participate in using Excel sofware in order to create graphs. They create the graphs using data that they gathered during the Rouge River Field Trip they attended. The produce bar graphs from the excel spreadsheets.
Curated OER
M & M Madness
Students work with the mathematics unit of collection, organization, and presentation of data. In this math and technology lesson plan, students use Valentine M & M’s and The Graph Club to sort and graph the various colored M & M’s.
Curated OER
Graphing Favorite Fruit
Third graders take poll and sort data, enter the data to create a spreadsheet and create bar and pie graphs.
Other popular searches
- Data Collection and Graphs
- Collect Data and Graphs
- Recording Data on Graphs
- Recording Data Into Graphs
- Data Collection Graphs


