Curated OER
Tulip Graphing
Students create a graph of tulip growth. In this data analysis lesson, students plant tulip bulbs and use graph paper to begin graphing data on the growth of the tulip.
Curated OER
Active Wear
Students interpret and analyze data. In this middle school mathematics lesson, students conduct an experiment in which they investigate which solar collector, black, white, or silver, absorbs the most heat. Students examine the graphs...
Curated OER
Mean, Median, and Mode 1
For this mean, median and mode worksheet, students use the measures of central tendency to describe given statistical data. Students identify the range of data, and match data to its representative bar graph. Two multi-step problems...
Curated OER
Effects of Temperature, Deviation on Climate
Young scholars collect and record data for a given city. They calculate standard deviation of temperature and analyze the impact of climate changes on a city's and culture.
Curated OER
Critter Encounter Chart
Students record data found at an assigned web site. In this data collection lesson, students access an assigned web site in order to complete a data chart about animals they see. They travel to different sections of the web site to find...
Curated OER
Types of Graphs
Fifth graders construct graphs. In this graphing lesson, 5th graders learn about various types of graphs such as bar, line, circle, picture and stem and leaf plot. Students work in groups to create examples of each graph.
EngageNY
From Ratio Tables, Equations and Double Number Line Diagrams to Plots on the Coordinate Plane
Represent ratios using a variety of methods. Classmates combine the representations of ratios previously learned with the coordinate plane. Using ratio tables, equations, double number lines, and ordered pairs to represent...
Curated OER
That's Predictable - Stream Side Science
Research the impact that changes in biotic or abiotic factors might have on an ecosystem. Debate for or against the changes and take action in the community. This resource ideally follows stream studies that young ecologists may have...
NASA
Newton Car
If a car gets heavier, it goes farther? By running an activity several times, teams experience Newton's Second Law of Motion. The teams vary the amount of weight they catapult off a wooden block car and record the distance the car...
Radford University
Connecting Scatter Plots and Correlation Coefficients Activity
Collect a variety of bivariate data. Groups determine sets of data that would provide a positive, negative, and no correlation. Team members gather their data through out the week. Scholars plot the data and determine the relationship...
Space Awareness
Greenhouse Effect
A greenhouse provides additional warmth and protection to the plants inside, but what if the greenhouse gets too hot? Pupils discuss and experiment with the difference between natural and anthropogenic greenhouse effect. They measure the...
Anti-Defamation League
The Gender Wage Gap
"Equal pay for equal work!" may sound logical but it is not the reality. High schoolers begin a study of the gender wage gap with an activity that asks them to position themselves along a line that indicates whether they strongly agree...
Curated OER
Virtual Field Trip
This hands-on resource has future trip planners analyze graphs of mileage, gasoline costs, and travel time on different routes. While this was originally designed for a problem-solving exercise using a Michigan map, it could be used as a...
Curated OER
Is there Treasure in Trash?
More people, more garbage! Young environmentalists graph population growth against the amount of garbage generated per year and find a linear model that best fits the data. This is an older resource that could benefit from more recent...
Curated OER
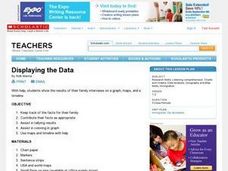
Displaying the Data
Students gather facts about their parent's families through the completion of parent interview forms. Using tally marks, the data gathered is counted, transferred to graphs and used to create family timelines.
Curated OER
Color Mixing
Students experiment with primary colored water to mix new colors. They record new colors on a simple data sheet and share opinions on their work.
Texas Instruments
Data Collection for Bar Graphs
Learners study the concept of central tendency in this data collection for bar graph lesson. They collect data outside as instructed and organize it into a bar graphs, then they list in specific groups the labels that appear on the...
Curated OER
When Dinosaurs Ruled the World
Students graph the varying sizes of dinosaurs. In this math and dinosaur lesson, students view dinosaur models and compare the different shapes and sizes of the dinosaurs. Students complete a dinosaur math activity, read The Dinosaur...
Curated OER
Grade 1: More Land or Water?
First graders listen as the teacher reads a story involving cross-continent traveling. Students collect a random sample by tossing an inflatable globe and recording whether they touch land or water each time they catch the globe in order...
Curated OER
Creek Detectives WISE On-line Research Community
Students investigate ways people cause harm to the environment. In this environmental lesson, students explore a case study on the Internet. Students explore all of the online activities and collect data for a presentation.
Curated OER
Positive Future Fair Project
Ninth graders view the film "Pay It Forward" and discuss what kind of public campaign is needed to move people to positive action. They consider different ways of presenting information (graphs, visual displays, etc.) as tools for...
Curated OER
Plastic Packaging
Students collect data. In this math instructional activity, students collect data about recyclable materials. Students develop a plan that will help the environment. Recycling plastic containers is discussed.
Curated OER
Tasty Tech Activity With Excel
Learners are introduce to basic Excel skills, rank their opinions of menu items from fast food restaurants, add their answers to the spreadsheet, and then create a simple graph of the results.
Other popular searches
- Data Collection and Graphs
- Collect Data and Graphs
- Recording Data on Graphs
- Recording Data Into Graphs
- Data Collection Graphs


