Curated OER
Elementary Statistics in Life
Students examine newspapers for graphs. They collect and sort data that is of interest to them. They enter data into a database and make comparisons using the information.
Curated OER
How Long...?
Students explore measurement. They use appropriate units of measurement for different sized objects. Students collect their data and enter it into an Excel data base. They graph their findings and analyze their outcomes.
Curated OER
Height and Weight
Third graders explore their height and weight. They measure the heights and weights of their peers. Students record their data using an Excel spreadsheet. They create a graph to compare the data and analyze it for a correlation between...
Curated OER
Weather, Weather, Everywhere!
Sixth graders collect weather data to compare temperatures around the world. Using the Internet, learners collect data, put it into spreadsheets, and analyze and graph the results. An interesting way to cover the topic of weather.
Curated OER
Comparing Temperatures and Latitudes
Eighth graders collect weather data from a variety of cities at the same latitudes, but on different continents. They organize data using spreadsheet program, generate graphs, and incorporate into a word processing document. Students...
Curated OER
Seasons and Cloud Cover, Are They Related?
Students use NASA satellite data to see cloud cover over Africa. In this seasons lesson students access data and import it into Excel.
Curated OER
Exploring Muscle Action in the Human Body
Students collect and graph data and use the internet to research the skeletal muscles.
Curated OER
Where Are the Bugs?
Students trap, collect and identify arthropods in a newly created desert tortoise preserve area over a period of one school year. They determine the rate at which various arthropods take up residence in the newly landscaped area. Data is...
Curated OER
Integers in the Weather
Middle schoolers engage in a clever lesson that combines meteorology with mathematical thinking. They use integers in relation to high and low temperatures that they record. They use a spreadsheet of weather data, a computer, and gain...
Curated OER
Shoe Showdown
Third graders use rulers to measure their shoe size in inches and centimeters. They then enter the class shoe measurements into an excel data base and graph the results of both to make the comparison.
Curated OER
Height versus Shoe Size
Students find a correlation between a person's height and his/her shoe size. They have access to entering data into lists on a graphing calculator and can complete scatter plots. Students read and interpret a scatter plot and use the...
Curated OER
MAISA and the REMC Association of Michigan
Students complete online research to study geography's impact on weather. In this geography and weather lesson, students research weather in their city for ten days using an online website. Students bookmark the site, enter data into a...
Curated OER
Weather's Outer Limits
Students make educated guesses and explain their reasoning and compile, graph, and map weather data. They then study environmental weather extremes on earth and discover that many variables determine climate.
Curated OER
Probability and Applications of Simulations
Middle schoolers apply properties of probability to the real world. In this probability lesson plan, learners simulate the construction of empirical distribution. They collect and analyze data using central tendencies.
Curated OER
Algebra 1
Students study the functional relationships of a variety of problems. In this functional relationship lesson, students determine the dependent and independent quantities of a given set of data. Students record the data and write it in...
Curated OER
From There To Here...
Young scholars find out where some of the products in hour homes come from, then become aware of our local trash, landfills and incinerators. They chart and graph data and use maps for different purposes.
Curated OER
How Does Your (Coral) Garden Grow?
Analyze and graph oxygen isotope ratios in coral samples in relation to the distance from the outer skeleton edge. Compare the data to the mean monthly water temperatures. Uncover whether or not there is any correlation. In addition to...
Curated OER
Kinzi Deaf Alumni
Learners use data of school alumni to create a database. The lesson uses technology and access to a computer lab is essential. The concepts of graphing statistics is also used to help teach across the curriculum.
Curated OER
Reading & Using a Nutrition Label
Students discover the importance of healthy eating. Using food nutrition labels, they read and examine the nutritional value. Students collect the data on a spreadsheet and create a graph. They analyze the media influences on product...
Curated OER
Cool Liquids
Chemistry neophytes use a temperature probe to assess the change as five different liquids evaporate. The implantation section suggests that they take readings every five seconds for a total of four minutes. They graph the data, look up...
Curated OER
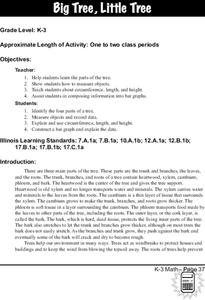
Trees
Students investigate the parts of a tree, measure its circumference and the length and width of its longest branch. The data is compiled and placed into a bar graph.
Curated OER
I Wonder How Fast Manduca Grows Compared To Me
Students study the Manduca bug and its growth data. They look for patterns and compare their own growth rate to that of the Manduca.
Curated OER
Investigating Properties of Water: Temperature
Investigate how temperature affects the density of water and stratification that occurs in bodies of water when temperatures vary. Water of differing temperatures is given different colors to see the layers that form. The lesson plan is...
Curated OER
Herb is the Word
Students graph the data collected on seedling establishment and
survival for each soil type over a 6 week period. Each lab group graphs data
gathered from one plant. They choose a color for each soil type and create a key for the...
Other popular searches
- Data Collection and Graphs
- Collect Data and Graphs
- Recording Data on Graphs
- Recording Data Into Graphs
- Data Collection Graphs


