Curated OER
Old Glory
Learners utilize mathematical concepts such as: measurement, ratio and proportion and geometric probability to analyze the components of the U.S. Flag. They collect, organize and interpret data by constructing charts, tables and graphs...
Curated OER
Why Doesn't My New Shirt Fit?
Learners test Leonardo da Vinci's view of the human body by measuring various body parts using a tape measure. They create a data table and a scatter plot and then analyze and interpret the results using a graphing calculator.
Curated OER
Linear Modelling of the Life Expectancy of Canadians
Middle and high schoolers explore the concept of linear modelling. In this linear modelling lesson, pupils find the line of best fit for life expectancy data of Canadians. They compare life expectancies of men and women, and find the...
Curated OER
Probability With a Random Drawing
Students define probability, and predict, record, and discuss outcomes from a random drawing, then identify most likely and least likely outcomes. They conduct a random drawing, record the data on a data chart, analyze the data, and...
Curated OER
What Pie?
Students practice making and interpreting pie graphs so they are better able to decide if a pie chart is the appropriate form of display. Students examine included overheads of different pie charts, and directions on how to make pie...
Curated OER
CSI Clamshell Investigation
Pupils explore and explain how moon snails eat and where the holes in clamshells come from and then draw conclusion from the data collected. They incorporate math and graphing skills to determine if there is a relationship to a clam's...
Curated OER
Breakfast Cereal - How Nutritious Is Yours?
Students analyze the nutritional value of breakfast cereal in order to make an informed choice. They create a stem and leaf plot which analyzes the nutritional value of the cereal they eat on a regular basis. Students write a letter to...
Curated OER
Team Apollo
Seventh graders brainstorm about problems with a school track. They research different possibilities for a solution. They test different track materials with erosion, durability, abrasiveness and resiliency. They determine the area,...
Curated OER
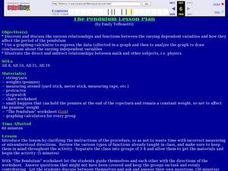
The Pendulum
Students discover and discuss relationships and functions between varying dependent variables and how they affect the period of the pendulum. They use graphing calculator to express the data collected in a graph, to analyze the graph,...
Curated OER
Great Tasting Shapes
Fifth graders investigate the concept of median, mode, and range using a simple model for display purposes. They examine different shaped crackers out of a box and identify the ones that occur the most. Then the calculations for the...
Curated OER
Experimenting with Pressure and Volume
Students investigate temperature and pressure with simple laboratory equipment. They use a handheld with sensors and probes to study temperature and pressure. Students explore the nature of gases with respect to temperature and are able...
Curated OER
Fresh Water and land of Kiribati and Hawaii (Molokai)
Fourth graders examine the islands of Hawaii. Using this information, they organize it and create a map or graph that represents the data. As a class, they discuss how the watersheds on the islands are different and how people react to...
Curated OER
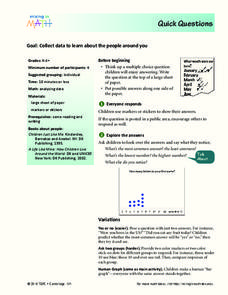
Quick Questions
Students ask their classmates survey questions. In this survey lesson, students come up with a question and possible answers. Their classmates mark their answers and the class discusses what they notice.
Curated OER
Hlf-Ball
Young scholars investigate Newton's Laws of Motion and the Law of Conservation of Energy. They examine how a ball and half-ball behave and relate these laws to what happens to the ball. Students produce a graph of the data collected...
Curated OER
Color Me Hot
Seventh graders use the scientific method, to observe, record and analyze the data they gathered. They make observations using their five senses. Students compare, contrast and draw conclusions based on the observations and data...
Curated OER
Hot Rocks
Learners demonstrate that setting of plaster and cement is a change, which involves a release of heat energy, use data collected experimentally to construct comparison graphs and analyze the graphs to make predictions about future...
Curated OER
M&M Statistics
Pupils determine the difference between guessing and making a prediction. They discuss what they could graph using a bag of M&M's. They take a Raw data sample and convert it into a sample. They graph the actual results and combine...
Curated OER
Graphing Favorite Colors
Third graders collect data and insert it into ClarisWorks to create a spreadsheet/graph of their favorite color. They interpret the data together.
Curated OER
Predicting Monthly Precipitation
Students should log onto, and collect data from, a specific site on the Internet. They average and compare the data using the Excel spreadsheet program, make predictions from their data, and determine the percent error of their predictions.
Curated OER
Survey and Share
Students practice collecting data by surveying other students. In this data collection lesson plan, students decide on a question and collects data from 15 other students. Eventually the students will end up graphing their results.
Curated OER
Tracks are for Trains
Second graders collect data on different forms of transportation and create a bar graph or pictograph with the information.
Curated OER
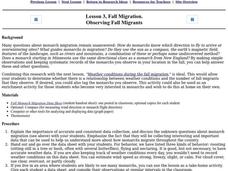
Observing Fall Migrants
Students keep a detailed data collection log of the different types of monarch behavior. They track the weather conditions daily and link it to the migration of the monarchs. They summarize their data using either a graph or a computer...
Curated OER
Bubbles
Third graders perform an experiment using different mixtures of dishwasher detergent. They construct bar graphs that record their bubble data for each detergent set.
Curated OER
RAIN
Third graders accurately measure the amount of rain in the rain gauge on a given day and create a bar graph of the data collected.
Other popular searches
- Data Collection and Graphs
- Collect Data and Graphs
- Recording Data on Graphs
- Recording Data Into Graphs
- Data Collection Graphs


