American Statistical Association
EllipSeeIt: Visualizing Strength and Direction of Correlation
Seeing is believing. Given several bivariate data sets, learners make scatter plots using the online SeeIt program to visualize the correlation. To get a more complete picture of the topic, they research their own data set and perform an...
Curated OER
Action-Reaction! Rocket
Students construct a rocket from a balloon propelled along a guide string. They use this model to learn about Newton's three laws of motion, examining the effect of different forces on the motion of the rocket. They measure the distance...
University of Minnesota
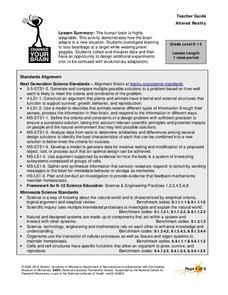
Altered Reality
Fascinate young life scientists by showing them how their brain learns. By using prism goggles while attempting to toss bean bags at a target, lab partners change their outlook on the world around them, producing amusing results....
American Statistical Association
Happy Birthday to . . . Two?
How many people do you need in a room before two likely share the same birthday? Scholars consider this puzzle by analyzing a set of data. They ponder how to divide the data and determine the proper size of a group for this event to...
Federal Reserve Bank
Cash Flow and Balance Sheets
What is your car worth? How much do you owe? Individuals create their personal cash flow and balance sheets. They learn the difference between an asset and liability using their personal information to complete the activity.
Curated OER
Sound Walk: Discovering Data and Applying Range, Mode, and Mean
Elementary schoolers sharpen their listening skills as they use sound maps, tallies, and line plots to organize and interpret data. Everyone takes a "sound walk," and focuses on the sounds around them. They chart and tabulate the sounds...
EngageNY
Calculating Conditional Probabilities and Evaluating Independence Using Two-Way Tables (part 1)
Being a statistician means never having to say you're certain! Learners develop two-way frequency tables and calculate conditional and independent probabilities. They understand probability as a method of making a prediction.
American Statistical Association
Scatter It! (Predict Billy’s Height)
How do doctors predict a child's future height? Scholars use one case study to determine the height of a child two years into the future. They graph the given data, determine the line of best fit, and use that to estimate the height in...
Curated OER
From Curiosity Cabinet to Museum Collection
Learners study binomial nomenclature and museum-based research. They create a curiosity box, label the objects in their curiosity box , develop a classification scheme for the objects, and create a database of all objects collected by...
US Department of Energy
Thermal Expansion of Water: Rise of Sea Level
Using bunsen burners, Erlenmeyer flasks, thermometers, hollow glass tubes, stoppers, and rulers, learners experiment with and measure how water expands when heated. The activity connects the expansion of water when heated to global...
Facebook
Cybersecurity, Phishing, and Spam
Take a serious look at an equally serious topic! Security scholars explore and discuss the methods hackers use to gain access to personal information during a well-written digital citizenship activity. Part of an extensive series, the...
Space Awareness
Fizzy Balloons - C02 in School
Carbon dioxide is a very important gas; it is present in the air, used in cooking, and supports plant and animal life. Scholars investigate the properties of carbon dioxide with three different activities. They experience a color change,...
EngageNY
Estimating Probability Distributions Empirically 2
Develop probability distributions from simulations. Young mathematicians use simulations to collect data. They use the data to draw graphs of probability distributions for the random variable in question.
Curated OER
Flight Dreams - Folding into Flight
Combine measurement, following directions, physics, and art with one fun activity. Learners read a set of instruction to create three different kinds of paper airplanes. They measure, fold, and fly the planes, and record data and answer...
Curated OER
Take a Chance on Probability
Connect ratios, probability, and combination outcomes with a challenging activity idea. It guides your learners through probability of an event as fractions or ratios, on a number line, and with correct vocabulary. The class will be...
University of New Orleans
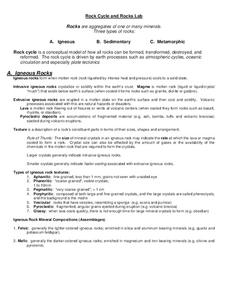
Rock Cycle and Rocks Lab
Science rocks! Explore three types of rocks and the rock cycle with an igneous rocks experiment. Pupils discuss textures, composition, and learn how melts are formed from the Earth's crust. They weigh materials using a scientific scale...
University of Georgia
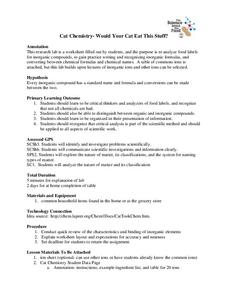
Would Your Cat Eat This Stuff?
Processed foods use inorganic compounds for flavoring and preservation. This take-home laboratory challenges scholars to find 20 different compounds identified on the labels of foods to list on their data collection sheet. The activity...
Foundation for Water & Energy Education
How Can Work Be Done with Water Power? Activity C
Third in a set of lessons regarding reservoirs, dams, and hydropower, this involves a two-day hydropower plant simulation. Collaborative groups build, maintain, and finance the plant. The transparency of the reservoir setup can be...
Just Health Action
Environmental Justice Matters: Mapping Cumulative Impacts (Part 2)
A case study enables class members to confirm whether different geographic parts of Seattle, Washington have disproportionate environmental burdens and benefits. Groups use the EPA's Cumulative Health Impact Analysis formula and...
Just Health Action
Environmental Justice Matters: Mapping Environmental Justice Impacts (Part 1)
A case study of Seattle, Washington permits class members to compare and rank how different areas of Seattle are impacted by environment burdens. Groups investigate different zip codes, collect data on five categories, and color-code a...
NASA
Hurricanes as Heat Engines
Hurricanes are a destructive yet fascinating phenomenon. Individuals examine evidence that hurricanes use thermal energy from the ocean as they approach land. Learners use images, charts, and graphs to collect data and then draw...
Curated OER
Fire Wars
Your class can practice collecting and analyzing data. They extrapolate information and derive data from fire season statistics. They also choose the most appropriate format to display collected data.
Curated OER
Coming to Know F and C
Students collect temperatures using a probe and examine data. In this temperature lesson students complete an activity using a graphing calculator.
Curated OER
Data Analysis and Probability Race to the Finish
Students practice addition facts, record data, and construct a bar graph. In this probability lesson, students participate in a board game in which bicycles move towards a finish line based on players completing addition problems. Dice...


