Teach Engineering
Spring Away!
The last segment of the nine-part unit makes a connection between springs and linear equations. Groups hang weights from the spring and measure its length. Then, using the data collected, they calculate the slope to find the k-value of...
Teach Engineering
Where Are the Plastics Near Me? (Field Trip)
With a piece of plastic here and a piece of plastic there, here a piece, there a piece, everywhere a piece. Teams go on a field trip in order to document the locations and kinds of plastic trash in an area near them. The eighth...
NASA
Down to Earth
There are only 10 types of people in the world: those who understand binary and those who don't. The lesson includes four activities in which students learn binary, convert binary to images, understand CCD arrays, and interpret...
Chicago Botanic Garden
Impacts of Climate on Forest Succession
Part two in a series of four explores the effects of climate on succession or the changing of plant species in a forest. Groups review how to identify trees and then spend a day in the field collecting extensive data on trees to...
Curated OER
Vernier - A Speedy Slide with EasyData™ App and CBR 2™
Mathematicians use a CBR 2™ motion detector to determine their speed or velocity going down a playground slide. They also experiment with different ways to increase their speed going down the slide. Finally, learners complete the Student...
American Statistical Association
Chocolicious
To understand how biased data is misleading, learners analyze survey data and graphical representations. They use that information to design their own plans to collect information on consumer thoughts about Chocolicious cereal.
Chicago Botanic Garden
Weather or Not
What is the difference between weather and climate? This is the focus question of a lesson that takes a deeper look at how weather data helps determine climate in a region. Using weather and climate cards, students decide if a statement...
American Statistical Association
EllipSeeIt: Visualizing Strength and Direction of Correlation
Seeing is believing. Given several bivariate data sets, learners make scatter plots using the online SeeIt program to visualize the correlation. To get a more complete picture of the topic, they research their own data set and perform an...
Curated OER
Action-Reaction! Rocket
Students construct a rocket from a balloon propelled along a guide string. They use this model to learn about Newton's three laws of motion, examining the effect of different forces on the motion of the rocket. They measure the distance...
University of Minnesota
Altered Reality
Fascinate young life scientists by showing them how their brain learns. By using prism goggles while attempting to toss bean bags at a target, lab partners change their outlook on the world around them, producing amusing results....
American Statistical Association
Happy Birthday to . . . Two?
How many people do you need in a room before two likely share the same birthday? Scholars consider this puzzle by analyzing a set of data. They ponder how to divide the data and determine the proper size of a group for this event to...
Federal Reserve Bank
Cash Flow and Balance Sheets
What is your car worth? How much do you owe? Individuals create their personal cash flow and balance sheets. They learn the difference between an asset and liability using their personal information to complete the activity.
Curated OER
Sound Walk: Discovering Data and Applying Range, Mode, and Mean
Elementary schoolers sharpen their listening skills as they use sound maps, tallies, and line plots to organize and interpret data. Everyone takes a "sound walk," and focuses on the sounds around them. They chart and tabulate the sounds...
EngageNY
Calculating Conditional Probabilities and Evaluating Independence Using Two-Way Tables (part 1)
Being a statistician means never having to say you're certain! Learners develop two-way frequency tables and calculate conditional and independent probabilities. They understand probability as a method of making a prediction.
American Statistical Association
Scatter It! (Predict Billy’s Height)
How do doctors predict a child's future height? Scholars use one case study to determine the height of a child two years into the future. They graph the given data, determine the line of best fit, and use that to estimate the height in...
Curated OER
From Curiosity Cabinet to Museum Collection
Learners study binomial nomenclature and museum-based research. They create a curiosity box, label the objects in their curiosity box , develop a classification scheme for the objects, and create a database of all objects collected by...
Teach Engineering
Efficiency of an Electromechanical System
How efficient is a motor in a LEGO set? Future engineers conduct an activity where a LEGO motor-generator system raises an object to a specified height. They then show what they learned and use their measurements to calculate the energy...
Bowland
My Music
Scholars investigate how the tempo of music affects heartbeats. Groups develop hypotheses about music and its connection to heartbeats before carrying out an experiment. They analyze and present data from their investigations.
PBS
Going Green
Trash is where it's at! Using bags of garbage collected from the school, learners sort the contents into categories based on type of material and collect data on the results. The data may include weight, volume, and/or percent of the trash.
US Department of Energy
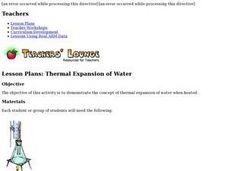
Thermal Expansion of Water: Rise of Sea Level
Using bunsen burners, Erlenmeyer flasks, thermometers, hollow glass tubes, stoppers, and rulers, learners experiment with and measure how water expands when heated. The activity connects the expansion of water when heated to global...
Facebook
Cybersecurity, Phishing, and Spam
Take a serious look at an equally serious topic! Security scholars explore and discuss the methods hackers use to gain access to personal information during a well-written digital citizenship activity. Part of an extensive series, the...
US Department of Commerce
Census in Counties - Describing and Comparing Histograms to Understand American Life
Use graphs to interpret life in 136 counties. Pupils analyze histograms and describe the shapes of the distributions of data collected from several counties on different aspects of life. Scholars make predictions on the difference in...
Teach Engineering
What's Wrong with the Coordinates at the North Pole?
Here is an activity that merges technology with life skills as individuals use Google Earth to explore the differences between coordinate systems and map projections. The self-guided instructional activity is the fourth segment in a...
Space Awareness
Fizzy Balloons - C02 in School
Carbon dioxide is a very important gas; it is present in the air, used in cooking, and supports plant and animal life. Scholars investigate the properties of carbon dioxide with three different activities. They experience a color change,...


