Curated OER
Vacation Values: A Math WebQuest
Fifth graders participate in a Math Web Quest to research two vacation options for their "families" in order to determine the best mathematical value for their family. They gather data, create two comparison graphs based on that data,...
Shodor Education Foundation
Algorithm Discovery with Venn Diagrams
Here is a lesson plan that takes an interesting approach to analyzing data using box and whisker plots. By using an applet that dynamically generates Venn diagrams, the class forms a strategy/algorithm for guessing the rule that...
Virginia Department of Education
Radioactive Decay and Half-Life
Explain the importance of radioactive half-life as your high school biologists demonstrate the concept by performing a series of steps designed to simulate radioactive decay. Pupils use pennies to perform an experiment and gather data....
Curated OER
2nd Grade - Act. 17: Source Relay
Help your 2nd graders understand the difference between natural and man-made materials. They will sort breakfast food items into sources: store, factory, natural world, and farm. They will work together to classify, form conclusions, and...
NASA
Geographical Influences
"If global warming is real, why is it so cold?" Distinguishing the difference between weather and climate is important when it comes to understanding our planet. In these activities, young scientists look at the climate patterns in a...
University of Georgia
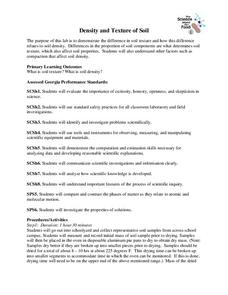
Density and Texture of Soil
All soil is not created equal! A lab activity asks learners to collect and analyze soil. Specific calculations determine the amount of sand, silt, and clay in a sample and allow individuals to identify the soil texture.
University of Colorado
Looking Inside Planets
All of the gas giant's atmospheres consist of hydrogen and helium, the same gases that make up all stars. The third in a series of 22, the activity challenges pupils to make scale models of the interiors of planets in order to...
Virginia Department of Education
Heat Transfer and Heat Capacity
It's time to increase the heat! Young chemists demonstrate heat transfer and heat capacity in an activity-packed lab, showing the transitions between solid, liquid, and gaseous phases of materials. Individuals plot data as the...
Polar Trec
Plankton Parents
Plankton are so abundant in the ocean they outweigh all of the animals in the sea. In this three day activity, groups discuss and become familiar with plankton, capture females, and look for egg production on day three.
Chicago Botanic Garden
Personal Choices and the Planet
The last activity in the series of four has individuals determine steps they can take to reduce their carbon footprints and then analyze their schools' recycling programs. Through a sustainability audit, they identify how and where their...
Anti-Defamation League
The Gender Wage Gap
"Equal pay for equal work!" may sound logical but it is not the reality. High schoolers begin a study of the gender wage gap with an activity that asks them to position themselves along a line that indicates whether they strongly agree...
Teach Engineering
Projections and Coordinates: Turning a 3D Earth into Flatlands
Introduce your class to map projections and coordinates, the basics for the work done in a GIS, with an activity that uses Google Earth to challenge learners to think about the earth's shape.
Curated OER
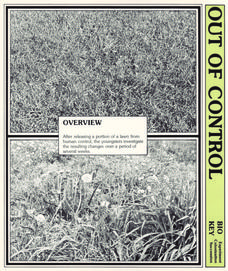
Out of Control
Students release care of a lawn. In this Science lesson, students observe the changes that occur when lawn maintenance is stopped. Students record data from several observations.
Curated OER
Go Fish!
Eighth graders use goldfish crackers to simulate a capture-recapture method of data collection. They fill in a chart and determine the averages. They find the estimated population of fish and the actual population of fish based on the...
Curated OER
Collecting My School Family Data
Students are tasked with collecting data on their school. In groups, they collect data on various aspects of school life along with social and economic backgrounds and charactertics of their hair and eye color. They draw two pictures,...
Curated OER
Lake Pepperidge Farm
Students calculate proportions to determine the total population of Lake Pepperidge Farm. They collect a blind sample of fish and count the number of tagged and untagged fish. They collect data from all samples and record the data in a...
Curated OER
Antlion Pit Building Investigation
Students design and perform an experiment related to comparing and contrasting antlion pits. Given a set of parameters, students select a hypothesis and perform observations on antlion pits. They record data and use this date to support...
Curated OER
Collect Data Using a Transect Line
Young scholars learn about transect lines through a study of marine debris. In this marine debris lesson, students calculate the items on a transect line and graph them. Young scholars complete a category worksheet.
Curated OER
Cardiac Hill
Students calculate pulse rates to determine level of exertion. In this human body lesson plan, students hike up a hill or steep slope and take their pulse. Students observe their breathing and energy level then record data.
Curated OER
Ball Toss Activity
Pupils collect data from tossing a ball into the air. Using a data collection device, they graph the data, set a window, and analyze the height of the toss, how long the ball was in the air, etc. They then find an equation that models...
Curated OER
The Great Race
Students identify the mean, median and mode of collected data. In this statistics lesson, students collect, graph and analyze data using central tendencies. They work in groups to collect data on a robot through an obstacle course.
Curated OER
Observing the Evidence
Fifth graders explore how to do research from a large group. They explore how to choose a representative sample and collect data from it.
Curated OER
Effects of Temperature, Deviation on Climate
Students collect and record data for a given city. They calculate standard deviation of temperature and analyze the impact of climate changes on a city's and culture.
Curated OER
Bias in Statistics
Students work to develop surveys and collect data. They display the data using circle graphs, histograms, box and whisker plots, and scatter plots. Students use multimedia tools to develop a visual presentation to display their data.


