Education Outside
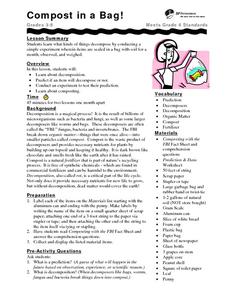
Compost in a Bag
Young scientists create a compost bag, predict changes, and after one month, examine the bag to observe the changes that have occurred.
Curated OER
The Hot Dog Stand
Students run a computer simulation. They collect data as they work and use the data to create an annual report for their business. Several different simulations could be used for this project. It is desirable for students to do this...
Curated OER
Sunrise-Sunset
Young scholars gather data, make and share predictions about the time of sunrise ans sunset in their area. Patterns are analyzed and shared with students from other areas.
Curated OER
Measurement (Grades 3-5)
Third, fourth, and fifth graders participate in measurement centers. They visit six different centers: standard and linear measurement, clocks, weight, volume, temperature, and converting measurements. They complete a data collection...
Curated OER
"who Lives in Your House?"
Fourth graders collect data about the people and animals living in their homes, and the students' shoe sizes. They work in groups to enter the information into a database from which they create graphs. They analyze the data to find the...
Curated OER
Probability: The Study of Chance
Students conduct an experiment, determine if a game is fair, and collect data. They interpret data, then display line graph. They conduct analysis of game for probability.
Curated OER
Evaluate Ecosystems
Ninth graders conduct an environmental inventory on one ecosystem. They collect data, and write an environmental impact statement on that area. Students explain the interactions between different systems found within an ecosystem....
Curated OER
"Mummies--The Great Cover Up"
Students wrap their mummy, use canopic-style jars for the preserved chicken organs and design and decorate a sarcophagus. They collect data by weighing, measuring and graphing their "mummy" and its organs.
Curated OER
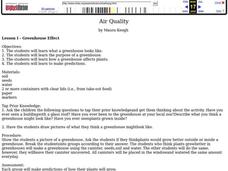
Air Quality
Young scholars participate in many activities examining air quality. They examine the purpose of a greenhouse and make predictions. They also collect data and make graphs and charts.
Curated OER
Strange New Planet
Fourth graders gather data and simulate a Mars spacecraft mission using multi-sensory observations.
Curated OER
Positive Future Fair Project
Ninth graders view the film "Pay It Forward" and discuss what kind of public campaign is needed to move people to positive action. They consider different ways of presenting information (graphs, visual displays, etc.) as tools for...
Curated OER
Making a Thermometer
Students observe a demonstration of how a thermometer functions. They apply the scientific method while determining which of three cups hold the coldest water. They write a hypothesis before conducting the experiment and gather data.
Curated OER
Citing Sources
Practice citation skills with this activity, which takes learners to the Library/Media center. There, they will view a Powerpoint presentation and practice collecting data in both print and non-print sources. All necessary materials are...
Curated OER
So You Would Like a Wind Farm, Eh?
Young scholars collect and analyze data correctly. In this statistics lesson, students use central tendencies to analyze collected data. They calculate where a wind farm will be placed, based on the data.
Curated OER
CAN'T TOUCH THIS!
Young scholars discover the best practical shielding material when dealing with radioactive substances. They draw conclusions based on availability of materials, price, and best shielding properties.
Curated OER
Toothpick Tops
Students assembly tops and name them 1 - 12 so that they can compare their results. They guess which top they think will spin the best and then record data on "Toothpick Top" table. Using a stopwatch or clock to measure and record the...
Curated OER
Flour Beetle
Students observe the life cycle of the common flour beetle and make observations of its life stages. They also design and implement an investigation on food preference for the beetle and record data over a period of several months....
Curated OER
Workshop: Health Challenge
High schoolers conduct Internet research in order to better understand the concepts of sustainable health design. For this design and architecture lesson, students gather data and creat a materials kit that responds to the challenges of...
Curated OER
Don't Slip!
Students measure, record, and graph the force of moving a block of wood along sand paper. In this friction lesson plan, students read a spring scale, collect data, construct a graph, and propose a model to explain how fiction works.
Curated OER
Interview! Magazine
Students interview a subject and write a biographical sketch for a fictional magazine. In this interview lesson, students choose a person to interview and create two sets of questions. Students conduct the interview. Students then write...
Curated OER
Chucky Chickadee's Bird and Breakfast: Sing in Please
Students observe bird feeding and complete a tally and graphing activity for their observations. In this bird graphing lesson plan, students work in teams to observe bird feedings. Students complete a bird reporting sheet and collect...
Curated OER
Analyzing Country Data
Pupils analyze different data in percentage form. In this statistics lesson, students plot data using box-plots, dotplot, and histogram. They compare and contrast the collected data using the boxplot.
Curated OER
Direct and Inverse Variation
Eighth graders participate in two data collection activities that involve direct and inverse variation. In the pre-assessment, 8th graders categorize numerical, graphical, and verbal representations as linear or nonlinear and determine...
Curated OER
Interpreting Medical Data
Students explore human anatomy by graphing scientific data. In this vision lesson, students discuss how ophthalmology works and take their own eye assessment test using the Snellen chart. Students collect vision data from all of their...


