Curated OER
Bias in Statistics
Students work to develop surveys and collect data. They display the data using circle graphs, histograms, box and whisker plots, and scatter plots. Students use multimedia tools to develop a visual presentation to display their data.
Curated OER
Machine Technology
Students work in pairs to manufacture a product for a potential customer. They interview potential customers and collect data. Students develop a customer interview profile. They manufacture drill drift part to customer's specifications...
Curated OER
Village Research
Sixth graders research global warming. In this science lesson, 6th graders collect data in the Waterton Townsite, Apgar Village and St. Mary area. Students interpret the data and form a hypothesis about global warming.
Curated OER
Graphing
Fifth graders practice using math graphs. In this graphing instructional activity, 5th graders work in groups to develop a topic of their own to represent as a graph. Students collect data and construct a graph for the instructional...
Curated OER
Dough Lake Topology
Students practice coordinates and measurements, develop 2D, 3D topological map, construct grid with string on real surface, establish "level" fixed point for measurements, take and record data points of elevation, and enter data on...
Curated OER
Graphing Iron Data
Students apply a data set to create a graph show how iron ore impacts an ecosystem. They explain how the iron effects the distribution and abundance of phytoplankton in coastal ecosystems using spreadsheet software.
Curated OER
Probability Experiment Simulation: Design and Data Analysis Using a Graphing Calculator
Seventh graders simulate probability experiments. Using a graphing calculator, 7th graders design, conduct, and draw conclusions from simulations or probability experiments. Students construct frequency tables and compare the...
Curated OER
Aerosol Lesson: Science - Graphing SAGE II Data
Students examine and plot atmospheric data on bar graphs.
Curated OER
Graphing Calculator Activity: Multiplying and Dividing Mixed Numbers
In this graphing calculator learning exercise, students explore necessary steps to multiply and divide mixed numbers using a graphing calculator. In groups, students measure objects in their classroom and write equations using their...
Curated OER
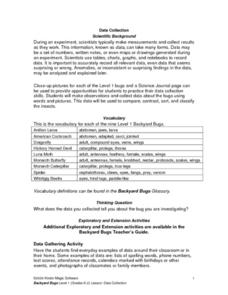
Science: Backyard Bugs Data Collection
Students practice data collection skills by observing common bugs found in their local environment. Once the data is collected they complete data sheets to compare, contrast, sort, and classify the insects. The lesson includes...
Curated OER
Data Collection Project
Students collect data using email. They calculate the mean, median, mode, range and outliers. They create a graph using the data results. They write five paragraphs to summarize their data.
Curated OER
Finding and Collecting in the Field
Students examine the types of plants brought over to America from immigrants. They research how some of these types of plants cause damage and alter the landscape. They record data and share the information with the community.
Curated OER
Genetics Lesson
Students investigate the genetic nature of skeletons while collecting data from an Internet site. They read a case study on the Internet and complete the associated activity.
Teach Engineering
Linear Regression of BMD Scanners
Objects may be more linear than they appear. Scholars investigate the relationship between the number of bone mineral density scanners in the US and time. Once they take the natural logarithm of the number of scanners, a linear...
Polar Trec
Ozone Data Comparison over the South Pole
Did you know the hole in the ozone is seasonal and filled by January every year? The lesson uses scientific measurements of the ozone over the South Pole to understand patterns. Scholars learn that the hole grew bigger annually before...
Curated OER
Gas Law Investigation
Investigators collect the carbon dioxide produced when an antacid tablet is activated and identify what alteration produced the most gas. They also collect the gas in a buret in order to practice precision. Then they choose between two...
Curated OER
Comparing Pulse Rates
Young scholars participate in a lab that demonstrate one example of how the human body maintains homeostasis. Students collect data from themselves and observe how their own bodies react to exercise.
Curated OER
Math in the Wetlands Field Trip
Get your class out in the environment for hands on math activities. In this wetlands lesson, learners transplant native plants, calculate how much soil is needed, and perform math activities based on this experience. They then make...
Curated OER
Solar Kit Lesson #8 - Positioning Solar Panels II: Explorations with Stationary Panels
This lesson plan is preparation-intensive, but well worth the investment. You will construct five or six portable testing stations with which lab groups will gather data on the best position for collecting sunlight with a solar panel....
Kenan Fellows
Absorbance Curves: Using Spectrophotometers to Quantize the Effects of a Strong Acid on a Buffer
The Henderson-Hasselbalch equation combined logarithmic terms with the application of carbonic acid as a buffer solution. Scholars learn investigate equation and its applications through hands-on experiments. They collect data and...
Social Media Toolbox
Social Media Survey
Survey says ... social media is here to stay! How do the pupils in your school use social media? Using lesson four from a 16-part series, The Social Media Toolbox, learners study surveys and create their own. The resource includes...
West Contra Costa Unified School District
Scientific Method Mania
Horrible science puns only happen periodically, but the scientific method is forever. Young scientists observe two presentations on the scientific method, complete independent practice worksheets, and integrate their knowledge through a...
Alabama Wildlife Federation
Big Fish, Little Fish
Tag, you're eaten! A instructional activity on predator-prey relationships uses the game freeze tag as a model. Learners become either a predator or prey and play a game of tag as the prey tries to reach areas that house food and...
Teach Engineering
Concentrating on the Sun with PVs
Concentrate to determine the best reflector design. Pairs use the engineering design process to build a reflector to increase the current output of a photovotaic panel. Teams arrive at a final design and present it to the class along...


