NOAA
El Niño
El Nino, La Nina ... and the Santa Maria? The 11th installment of a 23-part NOAA Enrichment in Marine sciences and Oceanography (NEMO) program explains the mechanism of El Nino/Southern Oscillation. Pupils use previous data to determine...
Teach Engineering
Show Me the Money
Class members learn how to estimate the total costs involved to design and build a bridge by including design, material, equipment, and labor costs. The activity includes a discussion about the trade-off between cost and aesthetics.
Towson University
It's a Gassy World!
How much does your class know about the relationship between climate change and carbon dioxide? Science scholars explore the nature of greenhouse gases and rising ocean temperature through demonstrations, research, and experiments. The...
Illustrative Mathematics
Tossing Cylinders
Everyone loves a lesson that involves throwing things around! To understand probability, your experimenters will predict how different cylinder-shaped objects will land when tossed. When the data is collected, they will calculate the...
Curated OER
Water in Earth's Hydrosphere
Environmentalists test stream water for temperature, pH, and turbidity. Each group shares their information and then the class makes an overall evaluation of the water quality. A slide show sets the backdrop for the teaching portion and...
US Environmental Protection Agency
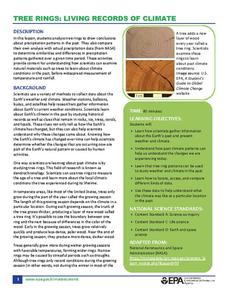
Tree Rings: Living Records of Climate
Open with a discussion on weather and climate and then explain how tree rings can provide scientists with information about the earth's past climate. Pupils analyze graphics of simulated tree rings from various US locations for the...
American Statistical Association
Confidence in Salaries in Petroleum Engineering
Just how confident can we be with statistics calculated from a sample? Learners take this into account as they look at data from a sample of petroleum engineer salaries. They analyze the effect sample size has on a margin of error and...
Virginia Department of Education
Weather Patterns and Seasonal Changes
Get your class outside to observe their surroundings with a lesson plan highlighting weather patterns and seasonal changes. First, learners take a weather walk to survey how the weather affects animals, people, plants, and trees during...
Serendip
Introduction to Osmosis
A chicken egg is a very large cell—perfect for investigating osmosis! Scholars conduct an experiment with vinegar and eggs that helps them understand the process of osmosis. They follow the activity with an in-depth look at osmosis in...
California Academy of Science
The Heat is On: Cause and Effect and Climate
The higher the number of letters in the final word for the National Spelling Bee, the higher the number of people killed by venomous spiders. Obviously, those two facts correlate, but no causation exists. Scholars view data based on...
Center for Learning in Action
Water – Changing States (Part 2)
Here is part two of a two-part instructional activity in which scholars investigate the changing states of water—liquid, solid, and gas—and how energy from heat changes its molecules. With grand conversation, two demonstrations, and one...
Statistics Education Web
Odd or Even? The Addition and Complement Principles of Probability
Odd or even—fifty-fifty chance? Pupils first conduct an experiment rolling a pair of dice to generate data in a probability instructional activity. It goes on to introduce mutually exclusive and non-mutually exclusive events, and how to...
Virginia Department of Education
Thermochemistry: Heat and Chemical Changes
What makes particles attract? Here, learners engage in multiple activities that fully describe colligative properties and allow the ability to critically assess the importance of these properties in daily life. Young chemists conduct...
Virginia Department of Education
Growing Patterns and Sequences
Learners explore, discover, compare, and contrast arithmetic and geometric sequences in this collaborative, hands-on activity. They build and analyze growing patterns to distinguish which kind of sequence is represented by a set of data...
Illustrative Mathematics
How Many Buttons?
Bring the class into the probability by having everyone count buttons on their shirts. Organize the data into the chart provided and chose different possibilities such as "female with one button" or "all students with more than four...
Learner
Solid Shapes
A collection of two lessons, kindergartners will identify two-dimensional shapes in solid shapes. They will develop basic knowledge of the components that make up a sphere, rectangular prism, pyramid, cylinder, cone, and cube. Young...
Messenger Education
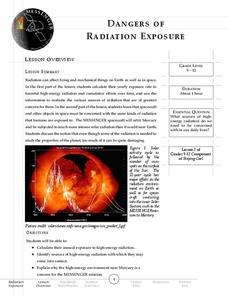
Dangers of Radiation Exposure
Gamma radiation, which is harmful, is useful in treating cancers. In the second lesson in a series of four, young scientists take surveys and calculate their yearly exposure to ionizing radiation. Then they read about how harmful their...
Nature Works Everywhere
Sharks and Shorelines
Examine predator-prey marine relationships through an interactive lesson design. Learners begin by studying a specific shark species and then analyze real-time shark-tracking data. They also study threats to shark populations and...
Science 4 Inquiry
The Classification of Living Things
It's a classification sensation! Demystify why we classify using an inquiry activity that helps your class sort things out. Groups begin by classifying a variety of shoes before they research organisms and design their own dichotomous...
Curated OER
Tools for Integrating Math and Engineering: Weighin' In
Learners collect and analyze data on a fictional cereal company's products. In this measurement lesson, students collect data from cereal boxes (weight, volume, surface area, etc.) to determine if the boxes labels correctly inform...
Curated OER
Using GLOBE Data to Study the Earth System (College Level)
Students use the GLOBE Website to locate and study environmental data. They use the GLOBE Graphing Tool to display data. Students describe the role of solar energy in the annual fluctuations of soil moisture. They describe reservoirs and...
Curated OER
What's Your Speed?
Learners explore the concept of distance v. time. They use a CBR to collect data on their distance over time, then plot their data using a scatter plot and find an equation to model their data. Pupils discuss what if scenarios which...
Curated OER
Dealing with Data
Seventh graders collect and analyze data. In the seventh grade data analysis lesson, 7th graders explore and/or create frequency tables, multiple bar graphs, circle graphs, pictographs, histograms, line plots, stem and leaf plots, and...
Curated OER
Data Analysis and Probability
Students make their own puzzle grid that illustrates the number of sit-ups students in a gym class did in one minute, then they make a histogram for this same data. Then they title their graph and label the scales and axes and graph the...


