Curated OER
Awesome authors (Elementary, Reading/Writing)
Fifth graders use technology to research and collect data. They develop awareness and appreciation of authors and genres. They organize information for presentation.
Curated OER
Biological and Agricultural Engineering
Eighth graders explore mathematics by conducting a series of investigations using a colorimeter. In this math lesson, 8th graders explain the purpose of food irradiation. They collect data and graph them.
Curated OER
Get a Half-Life!: Student Worksheet
In this math/science worksheet, students will work in pairs to conduct an experiment based on a decay function which is often used to model radioactive decay. Students will shake M & M's in a cup to rub off the M and then record...
Curated OER
History Repeats Itself
Twelfth graders research historical turning points, gather-data, and extrapolate possible alternate outcomes. They work individually to choose one historical event from Attachment D, Historical Turning Points. Students complete either...
Curated OER
Listening Logs
Students hone their listening skills. They develop tools for approaching research into their own musical traditions and those of community and state and examine different ways of recording data. They design different types of research...
Curated OER
Brine Shrimp Hatching Experiment
Learners hatch brine shrimp in a classroom experiment. In this hatching brine shrimp lesson, students participate in two-week lab in which they study how brine shrimp hatch under different conditions. They record data about the control...
Curated OER
1930 Census and the Consitution
Students read the Constitution and discuss the importance of enumeration. In this Census instructional activity, students complete a Census schedule and discuss the job skills of applicants. Students research Census data to compare and...
Curated OER
A Place for the Birds
Students reflect on bird migrations and develop a project to collect data on bird species from across North America to further investigate the ranges and migrations of common birds. They create a field guide of North American birds.
Curated OER
Questionnaires and Analysis
Students, review the techniques and different types of data analysis as well as how they are expressed, identify why facts and data are needed in conclusion of a questionnaire. The concepts of qualitative and quantitative data are...
Curated OER
Ocean Temperatures
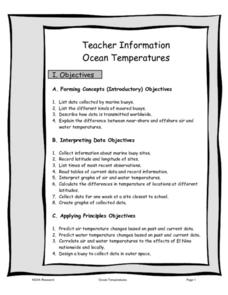
Students list data collected by marine buoys and the different kinds of moored buoys. They describe how data is transmitted worldwide. They explain the difference between near shore and offshore air and water temperatures.
Curated OER
Bats and Hot Dogs
Students identify patterns and relationships from data that is collected and solve variables. In this investigative lesson students study ocean productivity, the nitrogen cycle and phytoplankton then answer questions.
Curated OER
Temperature Bar Graph
Students explore mean, median and mode. In this math lesson, students analyze temperature data and figure the mean, median, and mode of the data. Students graph the data in a bar graph.
Curated OER
Probability Lesson Plan
Your learners will examine probability through experiments and dice games. Using a computer, your class will perform simple experiments to collect and analyze data to determine the probability of different experimental results. Young...
Curated OER
Student Heights
Students measure the heights of their fellow classmates and create a box and whisker plot to display the data. In this measurement lesson plan, students analyze the data and record results.
Curated OER
Survey Project
Eighth graders create a website using FrontPage. They use inserted forms to collect survey information and use Microsoft Excel and MS Word to create a presentation of the survey and the results.
Curated OER
Can You Make a Hole in One?
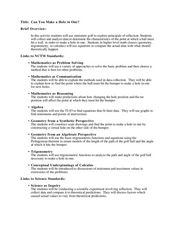
Students relate miniature golf to reflection of an image. In this algebra lesson, students collect and graph data as they study linear equations. They apply properties of graphing to solve real life scenarios.
Curated OER
Peppered Moth Simulation Activity
Students simulate peppered moth predators using SmartNotebook. In this life science instructional activity, students collect survival data and analyze results. They explain the importance of changes in species over time.
Curated OER
Collect the Weather Lesson Plan
Students explore the weather. In this weather spreadsheet instructional activity, students keep track of weather patterns as they use instruments and resources to chart the data the collect in spreadsheet form.
Curated OER
work in pairs for the activities of this lesson which include researching and identifying butterflies, writing, and a brief oral presentation.
Students explore the concepts of rdioactive decay and dating. They generate a radioactive decay table, use their data to plot a decay graph, develop the concept of half-life, and then use the graph to find the age of a mummified seal in...
Curated OER
Are There Too Many Elk?
Students study elk populations in Arizona. In this data lesson students read an article on monitoring elk populations, analyze data and make management recommendations.
Curated OER
The Working of Scientists
Students define and explain the basic concepts of experimental design. In this scientific method instructional activity students complete a hands on activity, develop and present proposals to test their explanations.
Curated OER
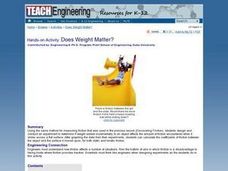
TE Activity: Does Weight Matter?
Students design and conduct experiment to determine if weight added incrementally to an object affects amount of friction encountered when it slides across a flat surface. They graph data from their experiments, and calculate...
Curated OER
Alfalfa Butterfly/Caterpillar Lifecycle Investigation
High schoolers collect and record data. They model specimens. Students identify sex of butterflies. They analyze data. High schoolers make conclusions based on collected data. They compare and contrast the different groups of insects...
Curated OER
Graphs: All About Our Class
Students respond to survey questions, discuss results, brainstorm ways to represent survey information, and create table of class results. They find mean, range, and percentages, and create graph to display results.


