Curated OER
Does Music Cam the Savage Beast?
Students collect, graph and analyze data. For this statistics lesson, students measure the heart beat of a person as they listen to music. They use the CBL and TI to create a graph, analyzing the outcome.
Curated OER
Collecting And Fitting Quadratic Data
Students investigate the concept of using quadratic data to plot coordinates on a plane. They also apply the quadratic formula for a variety of problems with the help of a graphing calculator to draw the parabola for given coordinates.
Curated OER
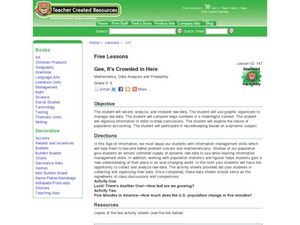
Gee, It's Crowded in Here
Students interpret raw data about population statistics. In this raw data lesson plan, students plug the data into graphic organizers and draw conclusions based on their findings.
Curated OER
Power Metering Project
High schoolers collect and analyze variable data and understand the concept of electrical power. In this energy lesson students use a spreadsheet to manage their data and create box plots.
Curated OER
Coin-a-copia: A Thanksgiving Glyph Activity
Students explore glyphs that are pictorial representations of data. Students collect and display data about themselves and a variety of other topics. Students practice using a legend to analyze and interpret data.
Curated OER
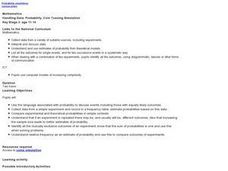
Handling Data: Coin Tossing Simulation
Students collect experimental data and record it on a frequency table. After accessing an Internet coin toss simulation site they discover that repetition of an experiment may result in different outcomes. They identify the mutually...
Curated OER
Mapping River Statistics
Students research different statistics to do with the Mississippi River. They answer questions about finding data and collect it by conducting research. The research is used to construct a data table. Then students use the table to...
Curated OER
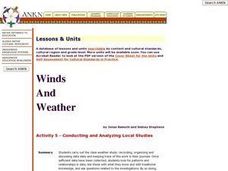
Conducting and Analyzing Local Studies
Students carry out the class weather study: recording, organizing and discussing data daily and keeping track of this work in their journals. They look for patterns and relationships in data, link these with what they know and with...
Curated OER
Calculating Buttons
Students, after reading "The Button Box" by Margarette S. Reid, analyze real-world data by surveying a sample space. They predict the generalization onto a larger population utilizing calculators and computers. Students total categories,...
Curated OER
Candy Bar Survey
Second graders investigate the skill of graphing data by using candy bars to create context for the lesson. They use technology for graphing and organizing information like a spreadsheet. The lesson includes a resource link to aid in the...
Curated OER
Math: Football Fever Fun
Students compile statistics from high school or other football team and construct a spreadsheet on which to record their findings. Using Chart Wizard to analyze the data, they construct charts and graphs for a visual display of the...
Curated OER
Permafrost
Students use a thermometer to analyze soil temperature data to determine which soil sample is normal, and which one is permafrost. In this permafrost lesson plan, students participate in a hands on activity where they identify the active...
Curated OER
Jumping to Conclusions
Students decide as a class what their data is going to be to graph. In this math lesson, students organize data so that it will be easier to display in a graph. Students are guided through the process by their teachers, and helped with...
Curated OER
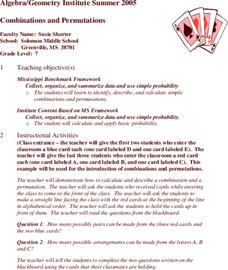
Combinations and Permutations
Fifth graders investigate the concepts of combinations and permutations using probability. They practice calculations using probability to measure the outcomes. Students demonstrate how to organize and categorize the data.
Curated OER
A "Sedimental" Journey-Sediment Collection
Students are asked how they would gather a sample of sediment from a lake, stream, river, pond, or swamp. They discuss safety concerns involving sample collections. Students are instructed to stay out of the water and to be careful not...
Curated OER
What is a Box and Whisker Plot?
Eighth graders explore the correct use of box and whisker plors. The times when they are appropriate to use to compare data is covered. They plot data according to statistical analysis including mean, median, and mode.
Curated OER
Tables, Charts and Graphs
Students examine a science journal to develop an understanding of graphs in science. In this data analysis lesson, students read an article from the Natural Inquirer and discuss the meaning of the included graph. Students create a...
Curated OER
Scientific Inquiry
Students investigate the general geology, biology, and chemistry of Seneca Lake. They study how to use scientific instruments on the research vessel. They explain how the data they gather will be used by scientists and develop a hypothesis.
Curated OER
Pancakes, Anyone?
First graders explore data collecting and graphing. In this data collecting and graping lesson, 1st graders watch a video about monster who sells pancakes. Students make a graph to record the most popular pancake. Students also play...
Curated OER
Range, Mean, Median, and Mode
Eighth graders find the range, median, mean, and mode of a data set. In this finding the range, median, mean, and mode of a data set lesson, 8th graders collect data about the high and low temperature for 10 different cities. Students...
Curated OER
Temperature High and Lows
Learners gather high and low temperature readings through email. For this temperature graphing lesson, students use a spreadsheet to input data for a graph. learners interpret the graphs to compare and contrast the data from different...
Curated OER
Dinosaur Tracks: From Stride To Leg Length To Speed
Students determine the relationship between leg length, stride length, and speed in humans and bipedal dinosaurs. They collect data and graph these human characteristics then use actual data collected from dinosaur track pads and fossils...
Curated OER
Butterfly Life Cycle
Second graders explore biology. In this life cycle instructional activity, 2nd graders act out the stages a caterpillar goes through to become a butterfly. They spend days prior to this instructional activity observing caterpillars they...


