Curated OER
Graphing Memories
Mem Fox’s Wilfrid Gordon McDonald Partridge provides the labels for a graphing activity. Class members create an illustration of a memory item brought from home, and place their illustration in the proper column of a graph. When the...
Curated OER
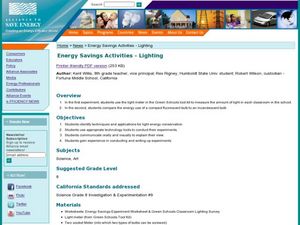
Energy Saving activities Lighting
Eighth graders study how light emits energy. In this energy savings activity, 8th graders conduct two experiments to find ways to save energy. In one experiment students measure the light in each classroom and make recommendations for...
Curated OER
Interpreting Your Data
In this water quality sampling learning exercise, students organize and analyze their data from samples they have collected. After analyzing based on 9 guide questions, they complete 18 short answer questions about fish, benthic, and...
Curated OER
Slip Slide'n Away
Students analyze the sliding of boxes along a warehouse floor. In this algebra lesson, students connect math and physics by calculating the friction created by the sliding of each box. They develop faster method to move the box, based on...
Curated OER
Saving Energy Through Ecological Landscape Design
Students are able to transcribe to scale the plant features of a common landscape. They determine true north and south and collect and record data on a table. Students calculate a rating for and describe a definition of insulation and...
Curated OER
Embracing Diversity
Students explore and use different computer programs for collecting data. In this technology based lesson, students set up a survey and use the Excel and Lotus software to collect data.
Curated OER
Confidence Levels
Learners collect data and graph it. In this statistics lesson, students rate confidence levels by collecting data and analyzing it. They graph their findings on the Ti calculator.
Curated OER
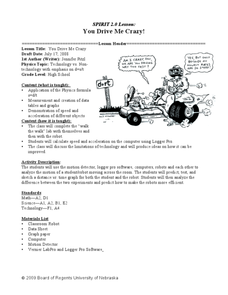
You Drive Me crazy
Students calculate the distance and acceleration of an object. In this algebra lesson, students collect data and create table and graphs to analyze it. They complete a lab as they collect and analyze data on acceleration and distance.
Curated OER
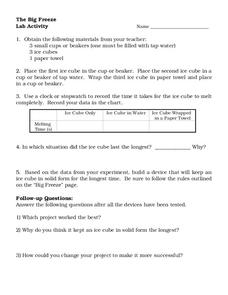
The Big Freeze
For this lab activity worksheet, students record the time it takes for an ice cube to melt in three different situations. After collecting data they design a container that will keep an ice cube in a solid state for as long as possible.
Curated OER
Investing
Students collect data on investments and draw conclusions. In this algebra lesson, students analyze exponential graphs as they relate to money. They discuss the cause of an account balance being high or low.
Curated OER
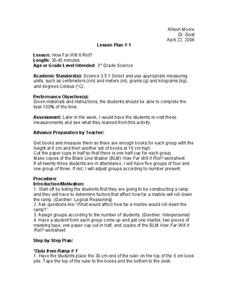
How Far Will It Roll?
Third graders investigate physics by conducting an experiment. In this gravity lesson, 3rd graders create a ramp using books and paper which they roll a marble down. Students utilize the scientific method to predict and record data...
Curated OER
Riding on a Pendulum
A comprehensive resource gets fourth grade physical scientists making observations about the period of a pendulum and then applying knowledge to a playground swing. Through seven different stations, they will record observations and...
Mr. Nussbaum
Abraham Lincoln Reading Comprehension—The Middle Years (Part 3)
How did Abraham Lincoln begin to change the minds of American citizens? Join him in his quest with a reading passage about Lincoln's experiences as a congressman and public denouncement of slavery. The resource contains reading...
Mr. Nussbaum
Abraham Lincoln Reading Comprehension—The Middle Years (Part 1)
Learn more about Honest Abe with an informative passage that details his life chronologically. As learners read sections of the text, they answer multiple choice questions that draw on their ability to recall details from the passage.
Curated OER
Quadratic Equations with the CBL 2
Learners practice generating parabolas with a motion sensor while determining the vertex form of the equation. They compare it to the regression equation from the calculator onto a data mate software. Each student completes several...
Center Science Education
Plugged In To CO2
Watt is going on here? Middle schoolers are learning about energy use and carbon dioxide emissions! In the first part of this lesson, learners measure how much energy different appliances consume and calculate the amount per day. In the...
Curated OER
How Dense is Salt Water?
Young schoolers explore the concept of linear regression. They determine the mass and density of salt water. Pupils add salt to water and record the density as salinity increases, and perform a linear regression on the data to model the...
Curated OER
Get a Half-Life Student Worksheet
Young scientists use a worksheet to help them perform a lab on the decay of a radioactive element. The worksheet serves as both a task guide and a lab sheet for pairs of learners. This activity requires a calculator and has excellent...
Curated OER
National Marine Sanctuaries Fish
Information is provided on Gray's Reef, Florida Keys, and Flower Garden Banks marine sanctuaries. Young marine biologists then visit the FishBase and REEF databases to collect fish species information for each location. They then...
Center Science Education
Looking Into Surface Albedo
How does the color of a surface affect the heating of the earth? Middle school science classes experiment with color and surface albedo to determine the relationship. The website has tabs for an overview, teacher's instructions,...
Mathematics Assessment Project
Mean, Median, Mode, and Range
What a find! Here is a lesson, designed to meet sixth grade math Common Core standards, that focuses on the calculation of different measures of center for the scores from a penalty shoot-out competition. An independent...
Curated OER
Graphs Abound
Young scholars create a survey for their classmates to collect data on their favorite foods, eye color, pets or other categorical data. They compile the data from the survey in a table and then make a bar graph of each category using a...
Curated OER
Confusing Colors!
Fourth graders collect data, graph their data, and then make predictions based upon their findings. They's interest is maintained by the interesting way the data is collected. The data collection experiment is from the psychology work of...
Curated OER
Closing the Case
Fifth graders collect data and prepare data displays using a survey with statistical information.


