Utah Education Network (UEN)
The Human Line Plot
Learners collect data and use charts and line plots to graph the data. Some excellent worksheets and activities are embedded in this fine lesson plan on line plots.
Statistics Education Web
I Always Feel Like Somebody's Watching Me
Future statisticians and potential psychics first conduct an experiment to collect data on whether a person can tell if someone is staring at them. Statistical methods, such as hypothesis testing, chi-square tests, binomial tests, and...
Curated OER
Feeling the Heat
Pupils record temperatures at different locations around campus. They examine the results and draw conclusions about how materials and colors affect the amount of heat produced. They also analyze Los Angeles' temperature records over a...
Curated OER
Bouncing Ball
Students collect height versus time data of a bouncing ball using the CBR 2™ data collection device. Using a quadratic equation they graph scatter plots, graph and interpret a quadratic function, apply the vertex form of a quadratic...
Virginia Department of Education
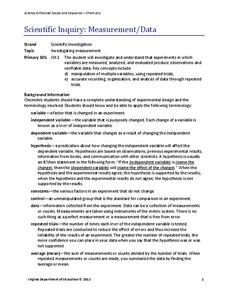
Scientific Inquiry: Measurement/Data
While pupils design their own lab experiments, they will not form a new species. Scholars take their materials and design an experiment regarding reaction rates.
Science 4 Inquiry
The Ups and Downs of Populations
Life has its ups and downs ... especially if you're an animal! Biology scholars engage in a population study through an inquiry-based instructional activity. Pupils work together to explore the factors that affect deer populations, then...
Statistics Education Web
Sampling in Archaeology
Compare different random sampling types using an archaeological setting. Scholars collect data from an archaeological plot using simple random samples, stratified random samples, systematic random samples, and cluster random samples....
Curated OER
How Many Letters Are In Your Name?
Students discover how to make a graph that represents the number of letters in their names. In this early childhood math lesson plan, students collect data, categorize data, and develop skills to analyze the pieces of data.
Curated OER
A Model for Natural Selection- Spaghetti Worms
Does the early bird really get the worm? If so, which color of worm does it prefer? In an exciting and easy week-long field investigation, young field biologists set up a one square meter feeding area for birds. If you have a webcam,...
Curated OER
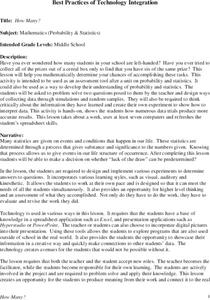
How Many?
Middle schoolers explore and design ways to collect data through simulations and random samples. They perform two experiments to determine the answers to various probability problems, and present the data/graphs in the form of a...
Curated OER
Vacation Values: A Math WebQuest
Fifth graders participate in a Math Web Quest to research two vacation options for their "families" in order to determine the best mathematical value for their family. They gather data, create two comparison graphs based on that data,...
Shodor Education Foundation
Algorithm Discovery with Venn Diagrams
Here is a lesson that takes an interesting approach to analyzing data using box and whisker plots. By using an applet that dynamically generates Venn diagrams, the class forms a strategy/algorithm for guessing the rule that fits the...
NASA
Geographical Influences
"If global warming is real, why is it so cold?" Distinguishing the difference between weather and climate is important when it comes to understanding our planet. In these activities, young scientists look at the climate patterns in a...
Virginia Department of Education
Average Atomic Masses
Facilitate learning by using small objects to teach the principles of atomic mass in your science class. Pupils determine the average mass of varying beans as they perform a series of competitive experiments. They gather data and...
NASA
Rocket Wind Tunnel
Using a teacher-built wind tunnel constructed from a paper concrete tube form, a fan, and a balance, individuals determine the amount of drag their rocket design will experience in flight. Pupils make modifications to increase the...
Curated OER
Sky Observations Sky & Cloud Windows
Young scholars observe the sky and weather to gather data. They conduct experiments to answer questions about the sky and weather phenomena. They measure, analyze and present data. They create sky windows by gluing sky colored paint...
Curated OER
It's Your Life - Safe or Sorry/Safety Issues
Students examine and chart data about safety hazards and unsafe situations. In this safety hazard lesson, students examine newspapers and web sites to investigate injuries from safety hazards. They make a spreadsheet using the data and...
PBS
Investigating Seasonal Temperature and Precipitation Variations
Weather seems unpredictable, but is it really? Learners collect weather data from online interactives and build data displays. They use their displays to identify temperature and precipitation patterns in different areas.
Curated OER
Foliage Tracker
Young scholars discuss the change of leaf colors and the role that climate and elevation play in those changes. They then track leaf changes, input data, and graph foliage changes with a free online tool.
Virginia Department of Education
Scatterplots
Math is all fun and games with this activity! Learners use an activity designed around hula hoops to collect data. They create scatter plots with their data and then analyze the graphs for correlation.
Curated OER
Species and Specimens: Exploring Local Biodiversity
Students practice skills essential to all scientific investigation: carefully observing and collecting data. They become field biologists in a series of hands-on activities to collect and identify specimens, and survey and calculate the...
Curated OER
Counting Coins
Second graders identify a quarter, dime, penny, nickel, and dime. They match the coin with it's monetary value, collect data on excel spreadsheet, and create a graph in Excel. Students participate in group activities.
Virginia Department of Education
Heat Transfer and Heat Capacity
It's time to increase the heat! Young chemists demonstrate heat transfer and heat capacity in an activity-packed lab, showing the transitions between solid, liquid, and gaseous phases of materials. Individuals plot data as the changes...
Curated OER
Color Burst
Fourth graders explore how colors react in water (chromatography) and other solvents. They observe, investigate, measure, record data and communicate their results in the form of graphs/charts and narration presented to the class....
Other popular searches
- Collect and Organize Data
- Data Collecting
- Data Sets Data Collection
- Collecting and Organizing Data
- Collection of Data
- Data Collections
- Collect and Analyze Data
- Collect and Classify Data
- Collecting and Using Data
- Collect and Organise Data
- Leaf Collection Data
- Games on Data Collecting


