University of Connecticut
Building Your Own Biosphere
On September 26, 1991, four women and four men entered the scientific experiment, Biosphere 2; the doors were sealed for two years in order to study the interactions of a biosphere. In the activity, scholars explore biospheres by...
Florida International University
The Good, the Bad and the Nasty Tasting
Examine the benefits of chemical defense mechanisms. Organisms in oceans use chemicals to ward off predators. Duplicate this adaptation using a hands-on experiment in which you ward off your predators (your pupils) with some bad-tasting...
101 Questions
Super Stairs
Keep your classes climbing in the right direction. Young mathematicians collect data from a video presentation. Using their data, they build an arithmetic sequence and use it to make predictions.
Curated OER
Solar Car Series: during What Part of the Day Can the Most Sun Power Be Collected?
In preparation for solar car races, middle schoolers attempt to discover what time of day the most solar energy can be collected. Begin by demonstrating the use of a voltmeter for measuring solar cell output. Take them outdoors to take...
National Wildlife Federation
Who Can Live Here?
Not all species can survive in all habitats. Using specific criteria, learners assess the fitness of a local habitat to a specific species. They collect data and suggest enhancements to create a suitable habitat for their chosen species.
101 Questions
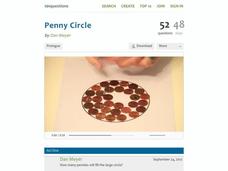
Penny Circle
Watch as your classes buy into a rich lesson full of information. A video opener challenges individuals to determine the number of pennies that fit in a circle with a 22-inch diameter. Using lesson materials, scholars collect data and...
Las Cumbres Observatory
Star In a Box
Stars may all look the same from down here, but their surfaces tell a different story. Using an animation, learners collect data about the temperature and luminosity of stars and compare them to their mass and radius. They then answer...
Curated OER
Rainbows, Bridges & Weather, Oh My!
Explore how real-world applications can be parabolic in nature and how to find quadratic functions that best fit data. A number of different examples of modeling parabolas are explored including a student scavenger hunt, the exploration...
Curated OER
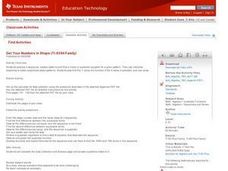
Get Your Numbers in Shape - TI-83
High Schoolers use the TI-83 calculator to produce a sequence, explore patterns and find a linear or quadratic equation for a given pattern. They use inductive reasoning to make conjectures about patterns. They find the Y-value of a...
Pennsylvania Department of Education
Multiplication Represented as Arrays
Third graders collect data about themselves and use in a line plot. In this analyzing data instructional activity, 3rd graders collect various sets of information,create a line plot and compare the data. Students complete a worksheet on...
Curated OER
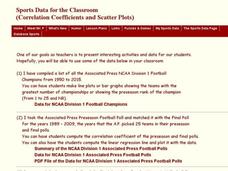
Sports Data for the Classroom
In this algebra worksheet,students rewrite word problems using algebraic expressions. They collect data and plot their findings on the graph and analyze it. There is an answer key for this worksheet.
Curated OER
Data Analysis and Probability Race to the Finish
Students practice addition facts, record data, and construct a bar graph. In this probability lesson, students participate in a board game in which bicycles move towards a finish line based on players completing addition problems. Dice...
Curated OER
Mosquito Life Cycle
Seventh graders investigate the life cycle of the mosquito. In this life cycle lesson, 7th graders gain knowledge about the diseases mosquitos carry. Students breed mosquitos and investigate their eggs. Students collect and record data...
Curated OER
Beginning Modeling for Linear and Quadratic Data
Students create models to represent both linear and quadratic equations. In this algebra lesson, students collect data from the real world and analyze it. They graph and differentiate between the two types.
Curated OER
Results and Conclusions
Fourth graders practice using the scientific method. In this results and conclusions lesson, 4th graders review data collected, create a graph of their data and make their final conclusions about the information collected.
Curated OER
M & Ms in a Bag
Students make predictions about the number and colors of M&M's in a snack size package. They create an Excel spreadsheet to record the data from their small group's bag, create a graph of the data, and discuss the variations of data...
Curated OER
La Toteca- A Tropical Paradise
Young scholars collect data on the time of the ferry. In this algebra lesson, students use the data to predict a ferry schedule. They also compute the depth where oxygen would be needed when diving.
Curated OER
The Fat and the Lean
Students collect data on calorie intake. In this algebra lesson plan, students use the collection of data to make better eating decisions. They investigate the nutritional value in food using a graph and draw conclusion from their findings.
Curated OER
Weather Patterns
Fourth graders collect and chart weather data over the course of the school year either using tools at school or media resources. They agree on weather terms to use in their observations and write them on the assigned sheet. Finally,...
Curated OER
Hand Sensitivity
Students experiment with the sense of touch. In this tactile lesson, students determine the most sensitive area of the hand. Students experiment by describing objects through touch only. Students compare the amount of sensory data...
Curated OER
Price of Apples- Linear Data
Young scholars collect data and create a graph. In this algebra lesson, students describe functions graphically, algebraically and verbally. They identify functions as being independent and dependent using variables.
Curated OER
Obstacles to Success: Misleading Data
Eleventh graders explore how data reported by country agencies can mislead the public intentionally or unintentionally. In this Cross Curricular activity, 11th graders analyze charts and graphs in order to draw conclusions. Students...
Curated OER
Explore: Collect And Organize Data
In this exploring how to collect and organize data worksheet, young scholars, working with a partner, problem solve the answers to seven word problems involving data.
Curated OER
Mystery Liquids: Linear Function
High schoolers determine the linear equations of the density of water and oil by collecting data on the mass of various volumes of each liquid. They construct scatter plots from the data and use these to write the linear equations for...
Other popular searches
- Collect and Organize Data
- Data Collecting
- Data Sets Data Collection
- Collecting and Organizing Data
- Collection of Data
- Data Collections
- Collect and Analyze Data
- Collect and Classify Data
- Collecting and Using Data
- Collect and Organise Data
- Leaf Collection Data
- Games on Data Collecting


