Code.org
Discover a Data Story
"Data is so boring, there's no way to find any patterns in them." Or is there? Pairs investigate data sets using different data visualization tools to discover a trend that may exist in a data set. Once they find a trend or pattern,...
Curated OER
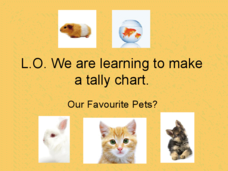
Pet Tally
Give the class an opportunity to practice using tally marks as a way to collect data. As you progress through the slide show, learners tally up the number and types of pets they see, they then use their data to create a tally chart....
EngageNY
Estimating Probabilities by Collecting Data
Take a spin to determine experimental probability. Small groups spin a spinner and keep track of the sums of the spins and calculate the resulting probabilities. Pupils use simulated frequencies to practice finding other probabilities to...
US Department of Commerce
How Does Our Class Compare?
Compare the class to the country. As a group, pupils collect data on the types of activities boys and girls do after school. Learners compare the number of girls to the number of boys for each activity. Using census data, individuals...
California Education Partners
Colorful Data
Scale up your lessons with a performance task. Young data analysts work through an assessment task on scaled bar graphs. They answer questions about a given scaled bar graph on favorite colors, analyze a bar graph to see if it matches...
US Department of Commerce
Creating and Taking a Survey
Individuals learn how to conduct surveys and collect data for the class on age, pets, and number of people at home. Scholars compare their household size to the information in the census. Pupils then develop additional questions to ask...
Curated OER
Diagnosing Allergies Through Data Collection
Students research and organize information about allergies. In this data collection lesson, students watch a video about allergies. Students create a histogram using the information collected. Students complete the 'Displaying Survey...
Curated OER
Data collection and analysis
In this probability and statistics worksheet, students determine when a survey or collected data could be biased. The one page worksheet contains a combination of three multiple choice and free response questions. Answers are included.
Curated OER
The Air Up There
In this data collection and analysis activity, learners observe and graph the weather conditions during one school week, then calculate the average weather temperature. Extensions are included.
American Statistical Association
How Long Are the Words in the Gettysburg Address?
It's 268 words, but one only needs to consider 10 of them at a time. A data collection and analysis activity has learners investigate the lengths of words in the Gettysburg Address. They first self-select a sample of 10 words and...
Curated OER
Data! Data! Graph that Data!
Fifth graders create data graphs using Microsoft Excel. In this data collection instructional activity, 5th graders create and conduct a survey, then use Excel to organize and graph their data.
Curated OER
Data Analysis Using Technology
Analyze data using technology. Middle schoolers design data investigations, describe data, and draw their own conclusions. Then they select the best type of graph, graph and interpret the data, and look for patterns in trends. They also...
Curated OER
Eastern European Studies
One worksheet, three projects. Learners explore Eastern Europe and mark Eastern European countries on a map. They then collect and record census data on thirteen different countries, and write a 3-5 page expository essay on one of the...
Curated OER
Walking the Plank
This is a cool math activity. Kids collect and interpret data based on a physical act. A board is balanced between a scale and a step, learners record a peer's weight as it decreases while s/he walks further away from the scale. They...
Curated OER
Student News And Weather Channel
Fabulous! Your 5th graders should love this project. As an ongoing lesson throughout the year students use temperature probes to record outside temperature and then document their data using spreadsheets. They use their weather data and...
Curated OER
Dance Challenge: Calculate and Compare Speed by Measuring a Series of Dance Movements
Really neat! Kids choreograph a dance phrase and then measure the distance and speed of the phrase using a timer and a meter stick. They collect the data on a table which they use to determine an average. A series of observation and...
Statistics Education Web
What Does the Normal Distribution Sound Like?
Groups collect data describing the number of times a bag of microwave popcorn pops at given intervals. Participants discover that the data fits a normal curve and answer questions based on the distribution of this data.
American Statistical Association
An A-MAZE-ING Comparison
Teach your class how to use descriptive statistics through a hands-on data collection activity. Pupils collect their own data, calculate test statistics, and interpret the results in context. They compare male and female results, looking...
American Statistical Association
How Fast Are You?
Quick! Snap up the instructional activity. Scholars first use an online app to collect data on reaction times by clicking a button when the color of a box changes. They then plot and analyze the data by considering measures of center,...
College Board
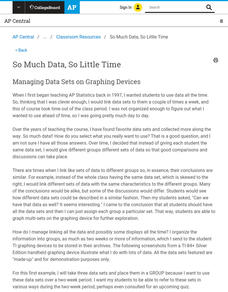
So Much Data, So Little Time
Organizing data in a statistics class is often a challenge. A veteran statistics teacher shares data organization tips in a lesson resource. The instructor shows how to group data to link to individual calculators in a more efficient...
Chicago Botanic Garden
Preparing for Project BudBurst
Male deer growing antlers to begin the breeding season is an example of a phenological event. First in a four-part series is an activity requiring individuals to collect phenological data on their campus. Classes discuss phenology, the...
Curated OER
Data Collection and Graphing
Students collect data and graph it on a coordinate plane and analyze it. In this statistics lesson, students display their data collection using a graph. They determine which central tendency will work best.
Curated OER
Teacher's Plant Collection Guide
Young scholars explore a variety of guidelines that involve collecting plants in a responsible manner and participate in a plant pressing activity. In this teacher's plant collection guide lesson, students collect data regarding plants,...
Curated OER
Data
Students collect data from an experiment they perform. In this data lesson, students use multiple representations to solve practical problems; describe advantages and disadvantages of the use of each representation. Then, they evaluate...
Other popular searches
- Collect and Organize Data
- Data Collecting
- Data Sets Data Collection
- Collecting and Organizing Data
- Collection of Data
- Data Collections
- Collect and Analyze Data
- Collect and Classify Data
- Collecting and Using Data
- Collect and Organise Data
- Leaf Collection Data
- Games on Data Collecting


